Physical Therapist Hourly Pay in Riverside, CA: $59.16 (2026)
Quick Answer:Hourly pay for a physical therapist working in Riverside, CA runs $59.16 at the median for 2026 — annualizing to $123,065 at a standard 2,080-hour year. Figures projected from BLS OEWS 2025 (SOC 29-1123). Weighted against Riverside's regional price level (BEA RPP 106.4, 6% above national), each hour of work buys what $55.58 nationally would. A 24-hour part-time schedule grosses $73,832 per year.
Official BLS data · View source
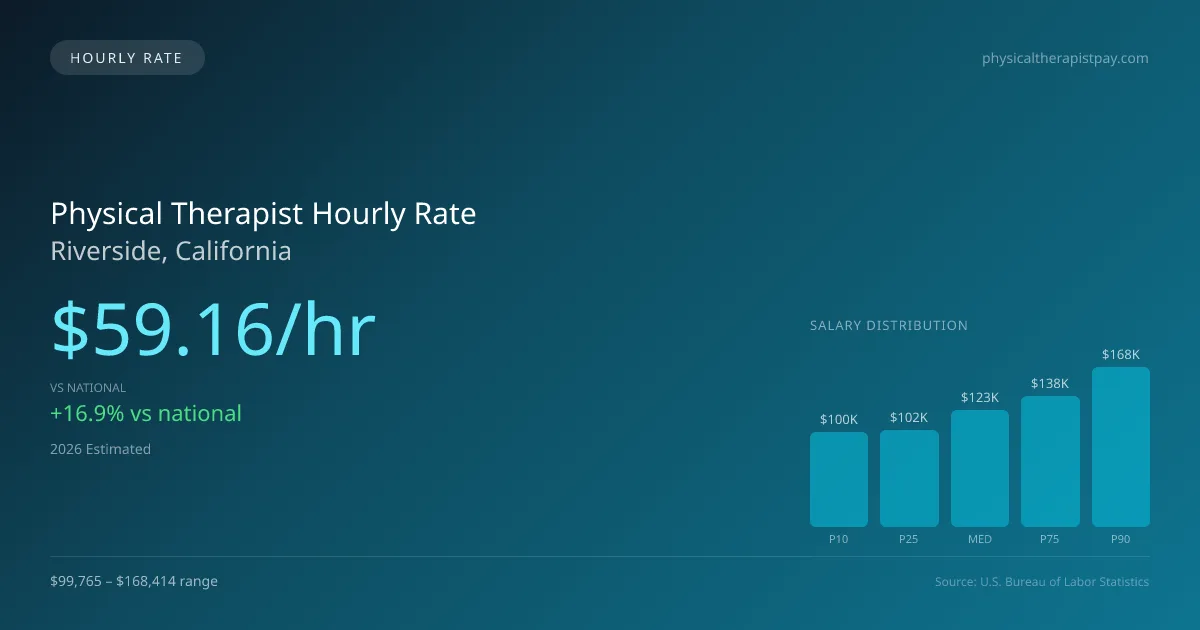
In Riverside, California, physical therapists earn a median hourly rate of $59.16, which is significantly higher than the national median of $50.62. This advantageous rate allows for a lucrative part-time career for those who prefer to work three days a week or as per-diem professionals across various settings. Whether in outpatient clinic gyms, home health environments, or rehabilitation units, physical therapists find themselves earning between $47.96 at the lower end of the scale to as much as $80.96 for top earners. This data comes from estimates based on 2025 BLS OEWS data, projected to 2026, reflecting the growing demand for physical therapy services in Riverside.
Physical Therapist Hourly Wage Breakdown
| Percentile | Hourly Rate | Per 8hr Shift |
|---|---|---|
| Entry Level (P10) | $47.96 | $383.69 |
| Lower Range (P25) | $49.18 | $393.45 |
| Median (P50) | $59.16 | $473.28 |
| Upper Range (P75) | $66.36 | $530.91 |
| Top Earners (P90) | $80.96 | $647.71 |
Estimated Annual Income by Work Schedule in Riverside
Based on $59.16/hr median hourly rate · 2026 est.
At $59.16/hr, a physical therapist working full-time (40 hr/wk) in Riverside, CA can expect to earn approximately $123,054 per year (2026 est.). Part-time hygienists working 24 hours per week would earn around $70,992. With a cost-of-living index of 106.44 (above the national average), these earnings may be offset by higher expenses in Riverside.
Hourly Rate Calculator
Schedule Comparison in Riverside
| Schedule | Weekly | Monthly | Annual |
|---|---|---|---|
| Full-Time (40 hrs) | $2,366.42 | $10,254 | $123,054 |
| Part-Time (24 hrs) | $1,419.85 | $6,153 | $73,832 |
| Per Diem (16 hrs) | $946.57 | $4,102 | $49,221 |
Compare PT Wages With Similar Roles
| Role | Median Hourly |
|---|---|
| Physical Therapist (Riverside) | $59.16 |
| Physical Therapist Assistant (National Avg) | $31.26 |
| Occupational Therapist (National Avg) | $47.00 |
| Chiropractor (National Avg) | $36.85 |
| Exercise Physiologist (National Avg) | $26.75 |
Physical Therapists in Riverside, CA earn a median of $123,065 per year (2026 est.), which is 16.88% higher than the national median of $105,288 and 4.30% below the California state average of $128,594.
Physical Therapist Hourly Pay vs. Cost of Living
Working 24h/week at $59.16/hr = $73,832/year (purchasing power: $69,364).
Working 40h/week (full-time) = $123,054/year (purchasing power: $115,606).
CoL index: 106.442 (100 = national average).
2019 BLS Actual
$48.85/hr
2025 BLS Actual
$57.74/hr
2026 Current Est.
$59.16/hr
2019–2027 Growth
+24.1%
Hourly Rate Trajectory for Physical Therapists in Riverside (2019–2027)
2019–2025: actual BLS OEWS data for this metro area. 2026+: CAGR 2.46% projection.
| Year | Hourly Rate | Status |
|---|---|---|
| 2019 | $48.85/hr | Actual |
| 2020 | $48.74/hr | Actual |
| 2021 | $48.05/hr | Actual |
| 2022 | $50.32/hr | Actual |
| 2023 | $52.08/hr | Actual |
| 2024 | $57.79/hr | Actual |
| 2025 | $57.74/hr | Actual |
| 2026(current) | $59.16/hr | Estimated |
| 2027 | $60.62/hr | Projected |
Based on 7 years of BLS OEWS metropolitan area data, the median hourly rate for physical therapists in Riverside grew 18.2% from $48.85/hr (2019) to $57.74/hr (2025). At a 2.46% projected growth rate, hourly pay is expected to reach $60.62/hr by 2027. Part-time and per-diem physical therapists can use this multi-year trend to benchmark future contract negotiations.
Note: Historical values (2019–2025) are actual BLS OEWS figures for the Riverside metropolitan area, sourced from annual Occupational Employment and Wage Statistics surveys. 2026–2026 figures are current estimates, and 2027 values are projections, calculated using a 2.46% CAGR derived from 7-year BLS historical data. Actual salaries may vary based on employer, experience, certifications, and local market conditions.
Working as an Hourly Physical Therapist in Riverside
Many physical therapists in Riverside find themselves weighing the benefits of part-time hours versus full-time employment. A part-time therapist working three days a week, totaling 24 hours, would earn about $73,529 annually, which is attractive compared to traditional full-time positions. For those in per-diem roles, the potential earnings can depend on location and employer; these therapists often see rates of $50 to $75 per hour, while travel PT contracts can yield weekly incomes between $1,800 and $2,800, including stipends. Typically, outpatient clinics, including industry leaders like ATI and Athletico, offer less per hour than hospitals but may provide productivity bonuses. Those opting for cash-pay routes, especially in sports medicine, might charge $150 to $250 per hour. Many are willing to accept lower hourly rates for the security of benefits offered by larger employers. As a physical therapist in this competitive market, understanding your worth and being prepared to negotiate can prove valuable when discussing your physical therapist hourly pay in Riverside, CA.
More salary data for Riverside, CA:
Frequently Asked Questions
What is the hourly rate for physical therapists in Riverside in 2026?
How much do part-time physical therapists make in Riverside?
Are physical therapists in Riverside paid hourly or salary?
How much does a full-time physical therapist make per year in Riverside?
Do physical therapists earn more per hour working part-time in Riverside?
Related Pages
Compare Salaries
Career Resources
Nearby Cities in California
Written by Alex Morgan, DPT
Career Analyst
Alex Morgan has over 10 years of experience in physical therapy. They specialize in orthopedic rehabilitation. Alex works in a private practice setting.
Methodology & Data Source
Hourly wage figures on this page are 2026 projections based on the Bureau of Labor Statistics Occupational Employment and Wage Statistics (OEWS) survey, May 2026 release. A 2.46% compound annual growth rate (CAGR), derived from 6-year national BLS wage trends, was applied to estimate current 2026 hourly rates for physical therapists in Riverside. Part-time and full-time income estimates assume consistent weekly hours and do not account for overtime, benefits, or seasonal variation.
Data Sources & Methodology
Source: BLS, OEWS, 7-year dataset (–). Per-city data from annual BLS metropolitan area surveys.
2026 figures are projected from 2025 BLS data using a compound annual growth rate (CAGR) of 2.46%, derived from historical BLS wage trends for physical therapists (SOC 29-1123).
Compiled and verified by Alex Morgan, DPT, a licensed physical therapist with 10+ years of clinical experience. · View source data at BLS.gov