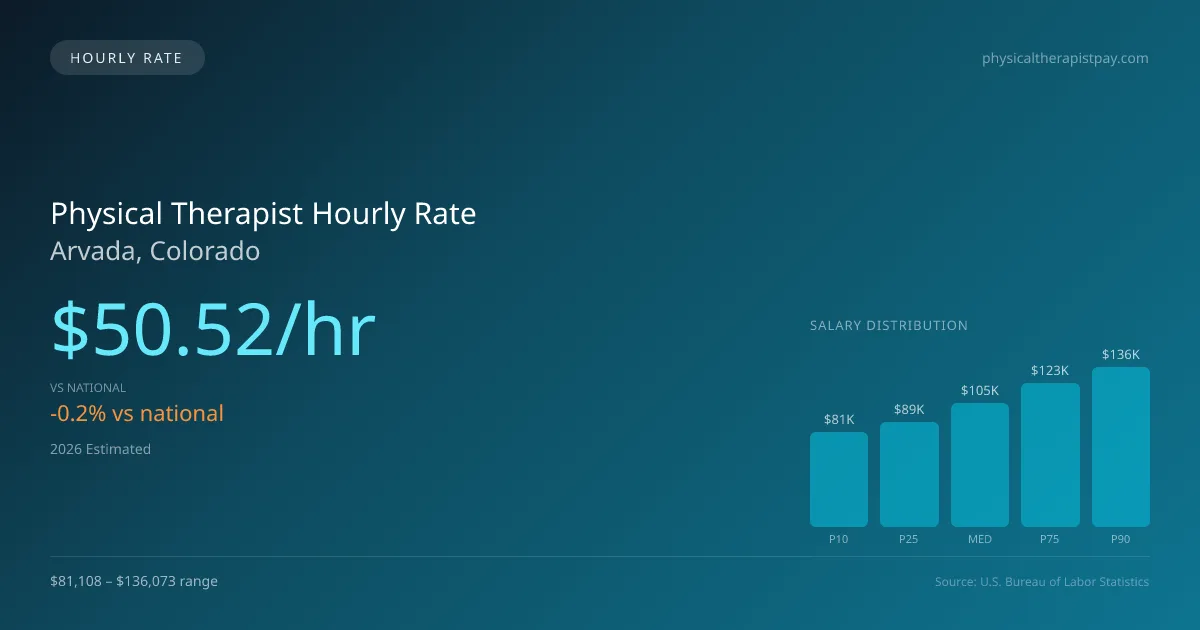
Physical Therapist Hourly Pay in Arvada, CO: $50.52 (2026)
Quick Answer:Hourly pay for a physical therapist working in Arvada, CO runs $50.52 at the median for 2026 — annualizing to $105,091 at a standard 2,080-hour year. Figures projected from BLS OEWS 2025 (SOC 29-1123). Weighted against Arvada's regional price level (BEA RPP 105.0, 5% above national), each hour of work buys what $48.12 nationally would. A 24-hour part-time schedule grosses $63,053 per year.
Based on BLS state-level estimates · View source
In 2026, the median hourly rate for physical therapists in Arvada, Colorado, is projected to reach $50.52, slightly lower than the national median of $50.62 per hour. This hourly pay structure is essential for part-time workers who typically operate for three days a week in various settings, including outpatient clinics, rehabilitation units, and home health visits. With entry-level positions starting around $39.00 per hour and experienced professionals earning up to $65.42, the flexibility of hourly work allows therapists in Arvada to tailor their schedules around personal needs while still benefiting from competitive earnings. Given that these figures are derived from annual salary estimates, they provide a glimpse into the income potential for both permanent and per diem roles in the area.
About the Arvada Market
Salary estimated from Colorado average ($93,000) adjusted for local cost of living.
Physical Therapist Hourly Wage Breakdown
| Percentile | Hourly Rate | Per 8hr Shift |
|---|---|---|
| Entry Level (P10) | $39.00 | $311.97 |
| Lower Range (P25) | $42.94 | $343.53 |
| Median (P50) | $50.52 | $404.18 |
| Upper Range (P75) | $58.99 | $471.89 |
| Top Earners (P90) | $65.42 | $523.37 |
Estimated Annual Income by Work Schedule in Arvada
Based on $50.52/hr median hourly rate · 2026 est.
At $50.52/hr, a physical therapist working full-time (40 hr/wk) in Arvada, CO can expect to earn approximately $105,088 per year (2026 est.). Part-time hygienists working 24 hours per week would earn around $60,628. With a cost-of-living index of 105.00 (above the national average), these earnings may be offset by higher expenses in Arvada.
Hourly Rate Calculator
Schedule Comparison in Arvada
| Schedule | Weekly | Monthly | Annual |
|---|---|---|---|
| Full-Time (40 hrs) | $2,020.92 | $8,757 | $105,088 |
| Part-Time (24 hrs) | $1,212.55 | $5,254 | $63,053 |
| Per Diem (16 hrs) | $808.37 | $3,503 | $42,035 |
Compare PT Wages With Similar Roles
| Role | Median Hourly |
|---|---|
| Physical Therapist (Arvada) | $50.52 |
| Physical Therapist Assistant (National Avg) | $31.26 |
| Occupational Therapist (National Avg) | $47.00 |
| Chiropractor (National Avg) | $36.85 |
| Exercise Physiologist (National Avg) | $26.75 |
Physical Therapists in Arvada, CO earn a median of $105,091 per year (2026 est.), which is 0.19% lower than the national median of $105,288 and 2.40% above the Colorado state average of $102,628.
Physical Therapist Hourly Pay vs. Cost of Living
Working 24h/week at $50.52/hr = $63,053/year (purchasing power: $60,050).
Working 40h/week (full-time) = $105,088/year (purchasing power: $100,084).
CoL index: 105 (100 = national average).
2019 BLS Actual
$42.92/hr
2025 BLS Actual
$49.31/hr
2026 Current Est.
$50.52/hr
2019–2027 Growth
+20.6%
Hourly Rate Trajectory for Physical Therapists in Arvada (2019–2027)
2019–2025: actual BLS OEWS data for this metro area. 2026+: CAGR 2.46% projection.
| Year | Hourly Rate | Status |
|---|---|---|
| 2019 | $42.92/hr | Actual |
| 2020 | $43.67/hr | Actual |
| 2021 | $45.88/hr | Actual |
| 2022 | $46.89/hr | Actual |
| 2023 | $47.85/hr | Actual |
| 2024 | $48.07/hr | Actual |
| 2025 | $49.31/hr | Actual |
| 2026(current) | $50.52/hr | Estimated |
| 2027 | $51.77/hr | Projected |
Based on 7 years of BLS OEWS metropolitan area data, the median hourly rate for physical therapists in Arvada grew 14.9% from $42.92/hr (2019) to $49.31/hr (2025). At a 2.46% projected growth rate, hourly pay is expected to reach $51.77/hr by 2027. Part-time and per-diem physical therapists can use this multi-year trend to benchmark future contract negotiations.
Note: Historical values (2019–2025) are actual BLS OEWS figures for the Arvada metropolitan area, sourced from annual Occupational Employment and Wage Statistics surveys. 2026–2026 figures are current estimates, and 2027 values are projections, calculated using a 2.46% CAGR derived from 7-year BLS historical data. Actual salaries may vary based on employer, experience, certifications, and local market conditions.
Working as an Hourly Physical Therapist in Arvada
Part-time physical therapists working 24 hours a week can expect to take home about $62,707 annually, a figure that reflects their hourly earnings but is significantly lower compared to full-time colleagues. Per diem positions enhance earning prospects, as many physical therapists charge rates between $50-$75 per hour, and travel contracts can yield as much as $2,800 per week, including bonuses. Variability in hourly rates can be found across different employer types; outpatient orthopedic clinics may offer less than acute care hospitals but provide productivity bonuses that can enhance overall compensation. Therapists must weigh the benefits of employment, such as health insurance, against the potentially greater hourly rates available in cash-pay settings or through travel PT agencies. Negotiating pay can be strategic; understanding the local market and articulating the value one brings to potential employers can lead to more favorable outcomes in the competitive field of physical therapy in Arvada.
More salary data for Arvada, CO:
Frequently Asked Questions
What is the hourly rate for physical therapists in Arvada in 2026?
How much do part-time physical therapists make in Arvada?
Are physical therapists in Arvada paid hourly or salary?
How much does a full-time physical therapist make per year in Arvada?
Do physical therapists earn more per hour working part-time in Arvada?
Related Pages
Compare Salaries
Career Resources
Nearby Cities in Colorado
Written by Alex Morgan, DPT
Career Analyst
Alex Morgan has over 10 years of experience in physical therapy. They specialize in orthopedic rehabilitation. Alex works in a private practice setting.
Methodology & Data Source
Hourly wage figures on this page are 2026 projections based on the Bureau of Labor Statistics Occupational Employment and Wage Statistics (OEWS) survey, May 2026 release. A 2.46% compound annual growth rate (CAGR), derived from 6-year national BLS wage trends, was applied to estimate current 2026 hourly rates for physical therapists in Arvada. Part-time and full-time income estimates assume consistent weekly hours and do not account for overtime, benefits, or seasonal variation.
Data Sources & Methodology
Salary data for Arvada is estimated from official BLS state-level occupational wage data (2025), adjusted for regional cost-of-living differences using BEA RPP (Regional Price Parities).
2026 figures are projected from 2025 BLS data using a compound annual growth rate (CAGR) of 2.46%, derived from historical BLS wage trends for physical therapists (SOC 29-1123).
Compiled and verified by Alex Morgan, DPT, a licensed physical therapist with 10+ years of clinical experience. · View source data at BLS.gov