Physical Therapist Hourly Pay in Moline, IL: $49.84 (2026)
Quick Answer:Hourly pay for a physical therapist working in Moline, IL runs $49.84 at the median for 2026 — annualizing to $103,661 at a standard 2,080-hour year. Figures projected from BLS OEWS 2025 (SOC 29-1123). Weighted against Moline's regional price level (BEA RPP 97.1, 3% below national), each hour of work buys what $51.32 nationally would. A 24-hour part-time schedule grosses $62,196 per year.
Based on BLS state-level estimates · View source
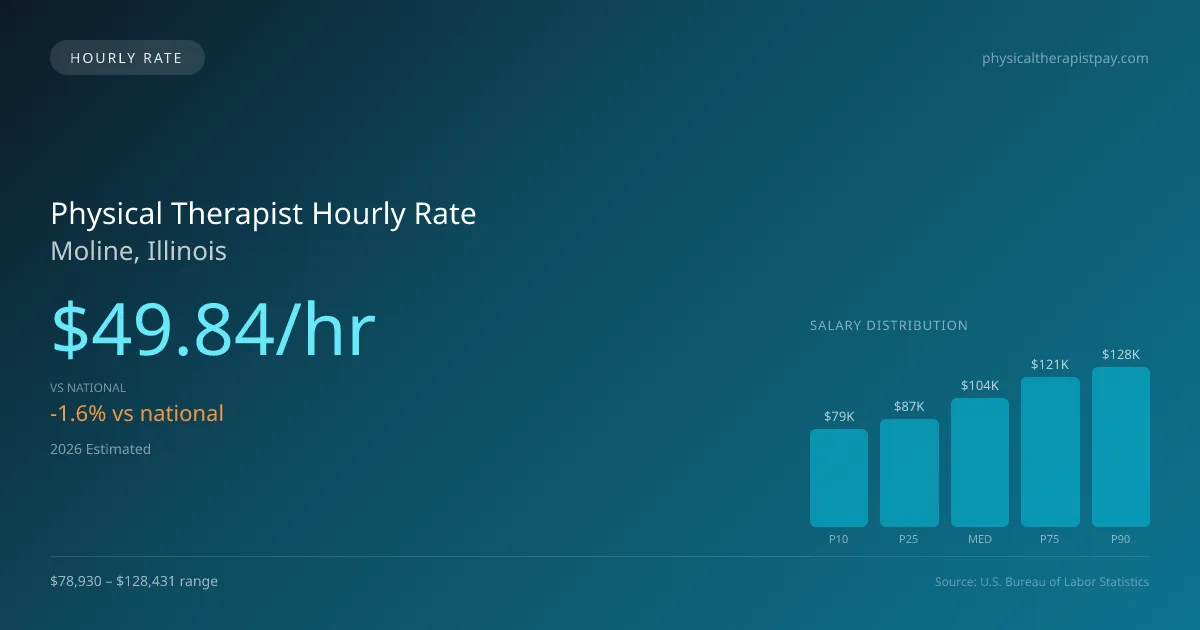
In Moline, Illinois, the physical therapist hourly pay averages approximately $49.84, slightly below the national hourly median of $50.62. This rate reflects the opportunities available for physical therapists across various settings, including outpatient clinics, hospital rehabilitation units, and home health visits. For those considering part-time or per-diem work, the hourly pay allows for a solid income, making it feasible to work three days a week while still covering essential living expenses. In addition to the median, entry-level positions may start around $37.95, while experienced professionals can earn up to $61.74 per hour, highlighting a significant wage discrepancy based on expertise and work environment. This hourly pay projection, derived from estimated annual data, provides insight into the potential for flexible work arrangements in the physical therapy field in Moline.
About the Moline Market
Salary estimated from Illinois average ($96,000) adjusted for local cost of living.
Physical Therapist Hourly Wage Breakdown
| Percentile | Hourly Rate | Per 8hr Shift |
|---|---|---|
| Entry Level (P10) | $37.95 | $303.61 |
| Lower Range (P25) | $41.74 | $333.94 |
| Median (P50) | $49.84 | $398.69 |
| Upper Range (P75) | $58.05 | $464.43 |
| Top Earners (P90) | $61.74 | $493.94 |
Estimated Annual Income by Work Schedule in Moline
Based on $49.84/hr median hourly rate · 2026 est.
At $49.84/hr, a physical therapist working full-time (40 hr/wk) in Moline, IL can expect to earn approximately $103,660 per year (2026 est.). Part-time hygienists working 24 hours per week would earn around $59,804. With a cost-of-living index of 97.10 (below the national average), these earnings stretch further in Moline.
Hourly Rate Calculator
Schedule Comparison in Moline
| Schedule | Weekly | Monthly | Annual |
|---|---|---|---|
| Full-Time (40 hrs) | $1,993.46 | $8,638 | $103,660 |
| Part-Time (24 hrs) | $1,196.08 | $5,183 | $62,196 |
| Per Diem (16 hrs) | $797.38 | $3,455 | $41,464 |
Compare PT Wages With Similar Roles
| Role | Median Hourly |
|---|---|
| Physical Therapist (Moline) | $49.84 |
| Physical Therapist Assistant (National Avg) | $31.26 |
| Occupational Therapist (National Avg) | $47.00 |
| Chiropractor (National Avg) | $36.85 |
| Exercise Physiologist (National Avg) | $26.75 |
Physical Therapists in Moline, IL earn a median of $103,661 per year (2026 est.), which is 1.55% lower than the national median of $105,288 and 0.60% above the Illinois state average of $103,043.
Physical Therapist Hourly Pay vs. Cost of Living
Working 24h/week at $49.84/hr = $62,196/year (purchasing power: $64,054).
Working 40h/week (full-time) = $103,660/year (purchasing power: $106,756).
CoL index: 97.1 (100 = national average). Your dollars stretch further here.
2019 BLS Actual
$42.34/hr
2025 BLS Actual
$48.64/hr
2026 Current Est.
$49.84/hr
2019–2027 Growth
+20.6%
Hourly Rate Trajectory for Physical Therapists in Moline (2019–2027)
2019–2025: actual BLS OEWS data for this metro area. 2026+: CAGR 2.46% projection.
| Year | Hourly Rate | Status |
|---|---|---|
| 2019 | $42.34/hr | Actual |
| 2020 | $43.08/hr | Actual |
| 2021 | $45.26/hr | Actual |
| 2022 | $46.25/hr | Actual |
| 2023 | $47.20/hr | Actual |
| 2024 | $44.24/hr | Actual |
| 2025 | $48.64/hr | Actual |
| 2026(current) | $49.84/hr | Estimated |
| 2027 | $51.06/hr | Projected |
Based on 7 years of BLS OEWS metropolitan area data, the median hourly rate for physical therapists in Moline grew 14.9% from $42.34/hr (2019) to $48.64/hr (2025). At a 2.46% projected growth rate, hourly pay is expected to reach $51.06/hr by 2027. Part-time and per-diem physical therapists can use this multi-year trend to benchmark future contract negotiations.
Note: Historical values (2019–2025) are actual BLS OEWS figures for the Moline metropolitan area, sourced from annual Occupational Employment and Wage Statistics surveys. 2026–2026 figures are current estimates, and 2027 values are projections, calculated using a 2.46% CAGR derived from 7-year BLS historical data. Actual salaries may vary based on employer, experience, certifications, and local market conditions.
Working as an Hourly Physical Therapist in Moline
Examining part-time earning prospects, a therapist working three days a week for a total of 24 hours would generate about $62,413 annually, compared to the more robust earnings of full-time practitioners. Per diem physical therapists in Moline typically earn between $50 and $75 per hour, illustrating the variation in pay based on employment type. For those in travel contracts, weekly compensation can range from $1,800 to $2,800, adding another layer of financial viability for PTs willing to pursue such arrangements. Hourly rates can differ significantly depending on employer type; outpatient orthopedic facilities may offer competitive wages, although larger hospital systems might present higher salaries but come with increased responsibilities. Physical therapists often trade-offs higher hourly wages for job security and benefits, leading to important negotiation considerations specific to Moline’s job market. Understanding this landscape allows professionals to make informed choices regarding their career paths, especially in an evolving healthcare environment influenced by acuity-based productivity demands and the push for cash-pay services over traditional insurance models.
More salary data for Moline, IL:
Frequently Asked Questions
What is the hourly rate for physical therapists in Moline in 2026?
How much do part-time physical therapists make in Moline?
Are physical therapists in Moline paid hourly or salary?
How much does a full-time physical therapist make per year in Moline?
Do physical therapists earn more per hour working part-time in Moline?
Related Pages
Compare Salaries
Career Resources
Nearby Cities in Illinois
Written by Alex Morgan, DPT
Career Analyst
Alex Morgan has over 10 years of experience in physical therapy. They specialize in orthopedic rehabilitation. Alex works in a private practice setting.
Methodology & Data Source
Hourly wage figures on this page are 2026 projections based on the Bureau of Labor Statistics Occupational Employment and Wage Statistics (OEWS) survey, May 2026 release. A 2.46% compound annual growth rate (CAGR), derived from 6-year national BLS wage trends, was applied to estimate current 2026 hourly rates for physical therapists in Moline. Part-time and full-time income estimates assume consistent weekly hours and do not account for overtime, benefits, or seasonal variation.
Data Sources & Methodology
Salary data for Moline is estimated from official BLS state-level occupational wage data (2025), adjusted for regional cost-of-living differences using BEA RPP (Regional Price Parities).
2026 figures are projected from 2025 BLS data using a compound annual growth rate (CAGR) of 2.46%, derived from historical BLS wage trends for physical therapists (SOC 29-1123).
Compiled and verified by Alex Morgan, DPT, a licensed physical therapist with 10+ years of clinical experience. · View source data at BLS.gov