Physical Therapist Salary in Flagstaff, AZ: $103,167 (2026)
Quick Answer:A full-time physical therapist in Flagstaff, AZ earns a median $103,167/year (≈ $49.60/hour) in nominal terms for 2026 — projected from BLS OEWS 2025 (SOC 29-1123). Once you factor in Flagstaff's price level (0% above national, BEA RPP 100.3), that paycheck buys what $102,833 would nationally. Nominal pay sits 2.5% below the Arizona state average.
Official BLS data · View source
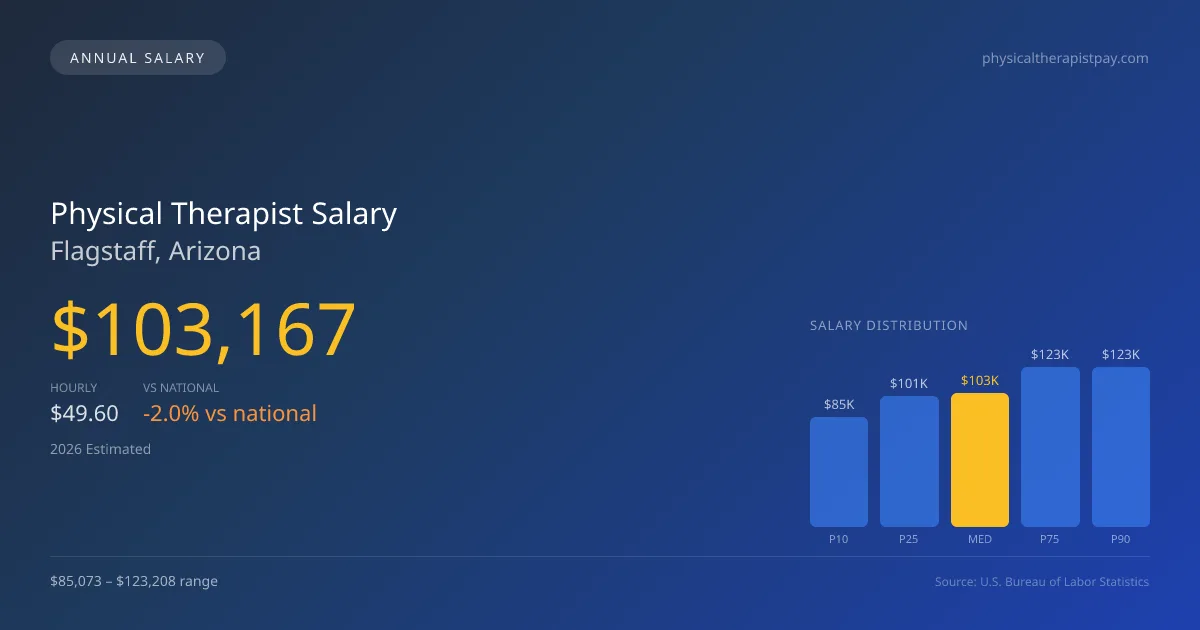
In 2026, physical therapist salaries in Flagstaff, Arizona, are projected to shine with a median annual compensation of $103,167. This figure positions local pay slightly below the national median of $105,288, reflecting a modest variance in remuneration within the industry. The salary spectrum ranges from $85,073 at the lower end (10th percentile) to as high as $123,208 (90th percentile), highlighting a solid earning potential based on individual skills and productivity. The data is sourced from 2025 BLS OEWS surveys, indicating that local physical therapists face expectations that can significantly impact their hourly pay. As a result, therapists must balance caseloads skillfully, navigating the pressures of daily visit quotas while delivering quality care.
Salary Breakdown
| Percentile | Annual | Hourly |
|---|---|---|
| Entry Level (P10) | $85,073 | $40.90 |
| Lower Range (P25) | $100,728 | $48.42 |
| Median (P50)(typical) | $103,167 | $49.60 |
| Upper Range (P75) | $123,208 | $59.23 |
| Top Earners (P90) | $123,208 | $59.23 |
Median Salary Position
2.01% below the national average
2026 Salary Percentile Distribution in Flagstaff
In Flagstaff, AZ, the physical therapist salary spread from the 10th to 90th percentile is $38,135 (2026 est.). At $103,167, the local median is 2.01% below the national median of $105,288.
Salary Calculator
At 40 hours/week in Flagstaff: You'd be in the lower-middle range
How Flagstaff Physical Therapist Pay Compares
Flagstaff median: $103,167/year (2026)
| Compared To | Median Salary | Flagstaff Pays |
|---|---|---|
| Arizona Average | $105,812 | -2.50% less |
| National Average | $105,288 | -2.01% less |
Physical Therapists in Flagstaff, AZ earn a median of $103,167 per year (2026 est.), which is 2.01% lower than the national median of $105,288 and 2.50% below the Arizona state average of $105,812.
Cost-of-Living Adjusted Salary
Flagstaff has a cost of living 0.33% above the national average.
Adjusted salary = nominal × (100 / CoL index). CoL index: 100 = national average.
Flagstaff, AZ has a cost-of-living index of 100.325 (above the national average of 100). While the nominal salary of $103,167 is competitive, the higher cost of living reduces purchasing power to an effective $102,833 — a 0.32% reduction.
Compare Purchasing Power
Select a city to see how your salary compares after cost of living
Select a city above to compare purchasing power
2019 BLS Actual
$83,710
2025 BLS Actual
$100,690
2026 Current Est.
$103,167
2019–2027 Growth
+26.3%
Salary Trajectory for Physical Therapists in Flagstaff (2019–2027)
2019–2025: actual BLS OEWS data for this metro area. 2026+: CAGR 2.46% projection.
| Year | Annual Salary | Status |
|---|---|---|
| 2019 | $83,710 | Actual |
| 2020 | $85,380 | Actual |
| 2021 | $95,590 | Actual |
| 2022 | $99,210 | Actual |
| 2023 | $96,980 | Actual |
| 2024 | $103,390 | Actual |
| 2025 | $100,690 | Actual |
| 2026(current) | $103,167 | Estimated |
| 2027 | $105,705 | Projected |
Based on 7 years of BLS OEWS data for the Flagstaff metropolitan area, the median physical therapist salary grew 20.3% from $83,710 (2019) to $100,690 (2025). At a 2.46% compound annual growth rate, salaries are projected to reach $105,705 by 2027 — a total increase of $21,995 (26.28%) from 2019.
Note: Historical values (2019–2025) are actual BLS OEWS figures for the Flagstaff metropolitan area, sourced from annual Occupational Employment and Wage Statistics surveys. 2026–2026 figures are current estimates, and 2027 values are projections, calculated using a 2.46% CAGR derived from 7-year BLS historical data. Actual salaries may vary based on employer, experience, certifications, and local market conditions.
Salary by Experience Level
| Experience | Estimated Salary Range |
|---|---|
| 0-2 years (New Graduate) | $85,073 – $100,728 |
| 3-5 years (Mid Career) | $100,728 – $103,167 |
| 5+ years (Experienced) | $103,167 – $123,208 |
| 10+ years (Top Earner) | $123,208 – $123,208 |
PT salary ranges estimated from BLS percentile data. Individual physical therapist compensation varies by employer, certifications, and specialization.
Physical Therapist Job Market in Flagstaff
Flagstaff's job market for physical therapists includes around 140 professionals, contributing to a competitive landscape. Although the area's cost-of-living index of 100.325 slightly exceeds the national average, it is essential for therapists to consider how this affects their financial flexibility. Employers in outpatient orthopedic clinics, such as ATI and Athletico, typically provide attractive pay paired with productivity bonuses, while hospital systems can offer higher base salaries. The disparity seen in salaries can often be attributed to various factors, such as expectations for visits per day and the benefits of board specialization like OCS or SCS. For those aiming to maximize their earning potential within this unique market, cultivating additional revenue through cash-pay services or pursuing leadership roles that include ownership stakes can be advantageous strategies. Understanding the nuances of Flagstaff's rehabilitation sphere can empower physical therapists to optimize their career trajectories effectively.
More salary data for Flagstaff, AZ:
Frequently Asked Questions
How much do physical therapists make in Flagstaff, AZ in 2026?
Is Flagstaff, AZ a good place to work as a physical therapist?
Can physical therapists make $100K in Flagstaff?
What is the cost-of-living adjusted physical therapist salary in Flagstaff?
How much does a physical therapist make per hour in Flagstaff?
Related Pages
Compare Salaries
Career Resources
Nearby Cities in Arizona
Written by Alex Morgan, DPT
Career Analyst
Alex Morgan has over 10 years of experience in physical therapy. They specialize in orthopedic rehabilitation. Alex works in a private practice setting.
Methodology & Data Source
Salary figures on this page are 2026 projections based on the Bureau of Labor Statistics Occupational Employment and Wage Statistics (OEWS) survey, May 2026 release. The BLS reported a median annual salary of $100,690 for physical therapistsin the Flagstaff metropolitan area. A 2.46% compound annual growth rate (CAGR), calculated from 6-year national BLS wage trends, was applied to project current 2026 compensation. Percentile ranges (P10–P90) represent the full salary distribution across experience levels and practice settings in this market.
Data Sources & Methodology
Source: BLS, OEWS, 7-year dataset (–). Per-city data from annual BLS metropolitan area surveys.
2026 figures are projected from 2025 BLS data using a compound annual growth rate (CAGR) of 2.46%, derived from historical BLS wage trends for physical therapists (SOC 29-1123).
Compiled and verified by Alex Morgan, DPT, a licensed physical therapist with 10+ years of clinical experience. · View source data at BLS.gov