Physical Therapist Salary in Maricopa, AZ: $107,202 (2026)
Quick Answer:A full-time physical therapist in Maricopa, AZ earns a median $107,202/year (≈ $51.54/hour) in nominal terms for 2026 — projected from BLS OEWS 2025 (SOC 29-1123). Once you factor in Maricopa's price level (1% below national, BEA RPP 98.5), that paycheck buys what $108,835 would nationally. Nominal pay sits 1.4% above the Arizona state average.
Based on BLS state-level estimates · View source
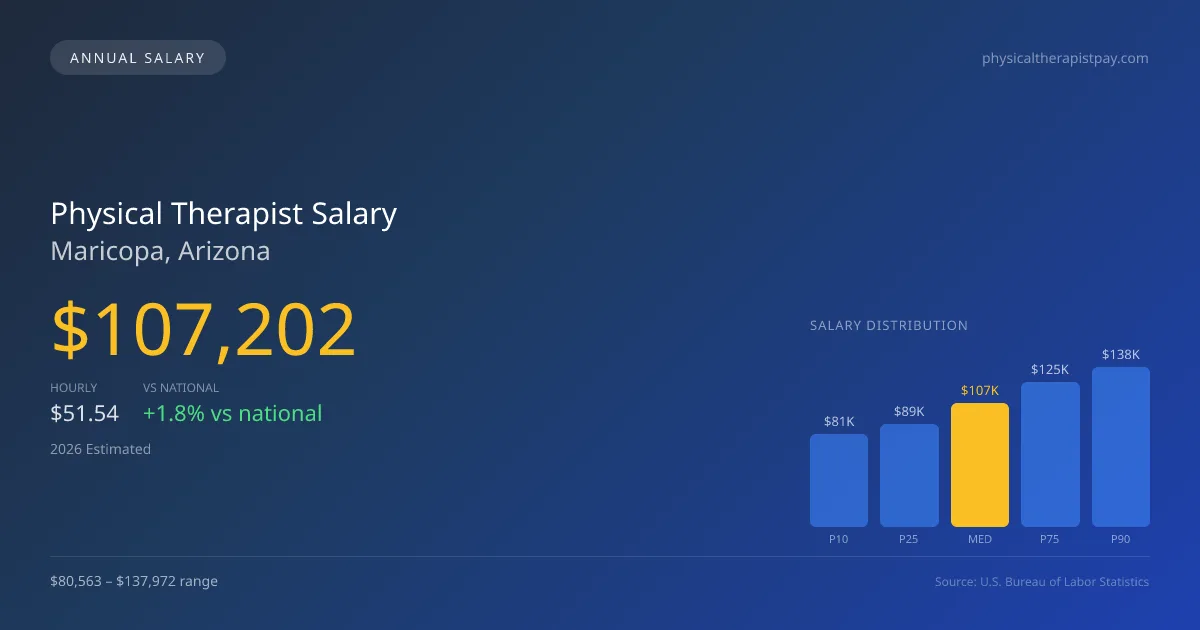
In 2026, professionals in Maricopa, Arizona, can expect a median annual salary of $107,202 as physical therapists, outpacing the national median of $105,288 by about 1.82%. The local salary range spans from $80,563 at the 10th percentile to as high as $137,972 at the 90th percentile, reflecting increasing opportunities, especially for cash-pay specialties in sports and orthopedics. These figures are derived from 2025 BLS data projected for 2026, taking into account regional cost adjustments. The emergence of cash-pay models has notably impacted top-end earnings, setting up a competitive environment that is driving demand and elevating compensation in this growing market for physical therapists in Maricopa.
About the Maricopa Market
Salary estimated from Arizona average ($95,000) adjusted for local cost of living.
Salary Breakdown
| Percentile | Annual | Hourly |
|---|---|---|
| Entry Level (P10) | $80,563 | $38.73 |
| Lower Range (P25) | $89,230 | $42.90 |
| Median (P50)(typical) | $107,202 | $51.54 |
| Upper Range (P75) | $125,312 | $60.25 |
| Top Earners (P90) | $137,972 | $66.33 |
Median Salary Position
1.82% above the national average
2026 Salary Percentile Distribution in Maricopa
In Maricopa, AZ, the physical therapist salary spread from the 10th to 90th percentile is $57,409 (2026 est.). At $107,202, the local median is 1.82% above the national median of $105,288.
Salary Calculator
At 40 hours/week in Maricopa: You'd be in the lower-middle range
How Maricopa Physical Therapist Pay Compares
Maricopa median: $107,202/year (2026)
| Compared To | Median Salary | Maricopa Pays |
|---|---|---|
| Arizona Average | $105,722 | +1.40% more |
| National Average | $105,288 | +1.82% more |
Physical Therapists in Maricopa, AZ earn a median of $107,202 per year (2026 est.), which is 1.82% higher than the national median of $105,288 and 1.40% above the Arizona state average of $105,722.
Cost-of-Living Adjusted Salary
Maricopa has a cost of living 1.50% below the national average, meaning your salary goes further here.
Adjusted salary = nominal × (100 / CoL index). CoL index: 100 = national average.
Maricopa, AZ has a cost-of-living index of 98.5 (below the national average of 100). A physical therapist earning $107,202 nominally has purchasing power equivalent to $108,835 in an average-cost city — an effective 1.52% boost.
Compare Purchasing Power
Select a city to see how your salary compares after cost of living
Select a city above to compare purchasing power
2019 BLS Actual
$91,066
2025 BLS Actual
$104,628
2026 Current Est.
$107,202
2019–2027 Growth
+20.6%
Salary Trajectory for Physical Therapists in Maricopa (2019–2027)
2019–2025: actual BLS OEWS data for this metro area. 2026+: CAGR 2.46% projection.
| Year | Annual Salary | Status |
|---|---|---|
| 2019 | $91,066 | Actual |
| 2020 | $92,664 | Actual |
| 2021 | $97,358 | Actual |
| 2022 | $99,496 | Actual |
| 2023 | $101,523 | Actual |
| 2024 | $94,851 | Actual |
| 2025 | $104,628 | Actual |
| 2026(current) | $107,202 | Estimated |
| 2027 | $109,839 | Projected |
Based on 7 years of BLS OEWS data for the Maricopa metropolitan area, the median physical therapist salary grew 14.9% from $91,066 (2019) to $104,628 (2025). At a 2.46% compound annual growth rate, salaries are projected to reach $109,839 by 2027 — a total increase of $18,773 (20.61%) from 2019.
Note: Historical values (2019–2025) are actual BLS OEWS figures for the Maricopa metropolitan area, sourced from annual Occupational Employment and Wage Statistics surveys. 2026–2026 figures are current estimates, and 2027 values are projections, calculated using a 2.46% CAGR derived from 7-year BLS historical data. Actual salaries may vary based on employer, experience, certifications, and local market conditions.
Salary by Experience Level
| Experience | Estimated Salary Range |
|---|---|
| 0-2 years (New Graduate) | $80,563 – $89,230 |
| 3-5 years (Mid Career) | $89,230 – $107,202 |
| 5+ years (Experienced) | $107,202 – $125,312 |
| 10+ years (Top Earner) | $125,312 – $137,972 |
PT salary ranges estimated from BLS percentile data. Individual physical therapist compensation varies by employer, certifications, and specialization.
Physical Therapist Job Market in Maricopa
Currently, only 10 physical therapists are employed in Maricopa, suggesting a niche yet competitive job market. The cost of living index here stands at 98.5, slightly below the national average, which can enhance the real purchasing power for physical therapist salaries. Among local employers, outpatient orthopedic clinics, particularly chains like ATI and Athletico, are generally major payers, but competition with hospitals and targeted specialty clinics can also elevate hourly rates significantly. Factors contributing to the wide salary disparity include expected productivity metrics, board certifications like OCS and SCS that can command higher stipends, and whether therapists operate under cash-pay or insurance models. To maximize earnings in Maricopa, physical therapists should aim for board certifications, consider private practice opportunities, and stay abreast of changing patient payment preferences in the evolving landscape of healthcare delivery.
More salary data for Maricopa, AZ:
Frequently Asked Questions
How much do physical therapists make in Maricopa, AZ in 2026?
Is Maricopa, AZ a good place to work as a physical therapist?
Can physical therapists make $100K in Maricopa?
What is the cost-of-living adjusted physical therapist salary in Maricopa?
How much does a physical therapist make per hour in Maricopa?
Related Pages
Compare Salaries
Career Resources
Nearby Cities in Arizona
Written by Alex Morgan, DPT
Career Analyst
Alex Morgan has over 10 years of experience in physical therapy. They specialize in orthopedic rehabilitation. Alex works in a private practice setting.
Methodology & Data Source
Salary figures on this page are 2026 projections based on the Bureau of Labor Statistics Occupational Employment and Wage Statistics (OEWS) survey, May 2026 release. The BLS reported a median annual salary of $104,628 for physical therapistsin the Maricopa metropolitan area. A 2.46% compound annual growth rate (CAGR), calculated from 6-year national BLS wage trends, was applied to project current 2026 compensation. Percentile ranges (P10–P90) represent the full salary distribution across experience levels and practice settings in this market.
Data Sources & Methodology
Salary data for Maricopa is estimated from official BLS state-level occupational wage data (2025), adjusted for regional cost-of-living differences using BEA RPP (Regional Price Parities).
2026 figures are projected from 2025 BLS data using a compound annual growth rate (CAGR) of 2.46%, derived from historical BLS wage trends for physical therapists (SOC 29-1123).
Compiled and verified by Alex Morgan, DPT, a licensed physical therapist with 10+ years of clinical experience. · View source data at BLS.gov