Physical Therapist Salary in Beaumont, CA: $124,944 (2026)
Quick Answer:A full-time physical therapist in Beaumont, CA earns a median $124,944/year (≈ $60.07/hour) in nominal terms for 2026 — projected from BLS OEWS 2025 (SOC 29-1123). Once you factor in Beaumont's price level (13% above national, BEA RPP 113.1), that paycheck buys what $110,472 would nationally. Nominal pay sits 2.8% below the California state average.
Based on BLS state-level estimates · View source
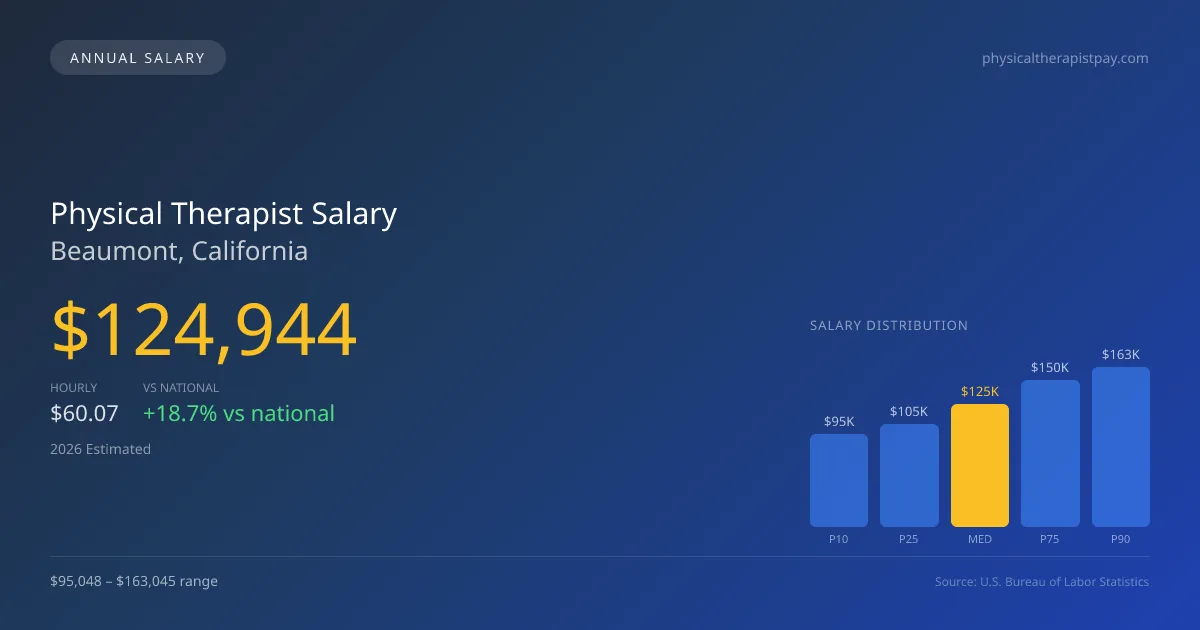
In 2026, physical therapists in Beaumont, California, are projected to earn a median annual salary of $124,944, which exceeds the national median by approximately 18.67%. This compensation reflects the increasing demands within the field, as productivity expectations play a significant role in shaping effective hourly compensation. Local salaries range from $95,048 at the 10th percentile to $163,045 at the 90th percentile. Estimates derived from the Bureau of Labor Statistics (BLS) state-level data and regional price adjustments indicate that these salary figures should be viewed within the context of Beaumont's specific job market dynamics, where factors such as patient volume can significantly influence earnings.
About the Beaumont Market
Salary estimated from California average ($109,000) adjusted for local cost of living.
Salary Breakdown
| Percentile | Annual | Hourly |
|---|---|---|
| Entry Level (P10) | $95,048 | $45.70 |
| Lower Range (P25) | $105,150 | $50.55 |
| Median (P50)(typical) | $124,944 | $60.07 |
| Upper Range (P75) | $149,841 | $72.04 |
| Top Earners (P90) | $163,045 | $78.38 |
Median Salary Position
18.67% above the national average
2026 Salary Percentile Distribution in Beaumont
In Beaumont, CA, the physical therapist salary spread from the 10th to 90th percentile is $67,997 (2026 est.). At $124,944, the local median is 18.67% above the national median of $105,288.
Salary Calculator
At 40 hours/week in Beaumont: You'd be in the lower-middle range
How Beaumont Physical Therapist Pay Compares
Beaumont median: $124,944/year (2026)
| Compared To | Median Salary | Beaumont Pays |
|---|---|---|
| California Average | $128,543 | -2.80% less |
| National Average | $105,288 | +18.67% more |
Physical Therapists in Beaumont, CA earn a median of $124,944 per year (2026 est.), which is 18.67% higher than the national median of $105,288 and 2.80% below the California state average of $128,543.
Cost-of-Living Adjusted Salary
Beaumont has a cost of living 13.10% above the national average.
Adjusted salary = nominal × (100 / CoL index). CoL index: 100 = national average.
Beaumont, CA has a cost-of-living index of 113.1 (above the national average of 100). While the nominal salary of $124,944 is competitive, the higher cost of living reduces purchasing power to an effective $110,472 — a 11.58% reduction.
Compare Purchasing Power
Select a city to see how your salary compares after cost of living
Select a city above to compare purchasing power
2019 BLS Actual
$106,137
2025 BLS Actual
$121,944
2026 Current Est.
$124,944
2019–2027 Growth
+20.6%
Salary Trajectory for Physical Therapists in Beaumont (2019–2027)
2019–2025: actual BLS OEWS data for this metro area. 2026+: CAGR 2.46% projection.
| Year | Annual Salary | Status |
|---|---|---|
| 2019 | $106,137 | Actual |
| 2020 | $108,000 | Actual |
| 2021 | $113,471 | Actual |
| 2022 | $115,963 | Actual |
| 2023 | $118,325 | Actual |
| 2024 | $119,796 | Actual |
| 2025 | $121,944 | Actual |
| 2026(current) | $124,944 | Estimated |
| 2027 | $128,017 | Projected |
Based on 7 years of BLS OEWS data for the Beaumont metropolitan area, the median physical therapist salary grew 14.9% from $106,137 (2019) to $121,944 (2025). At a 2.46% compound annual growth rate, salaries are projected to reach $128,017 by 2027 — a total increase of $21,880 (20.61%) from 2019.
Note: Historical values (2019–2025) are actual BLS OEWS figures for the Beaumont metropolitan area, sourced from annual Occupational Employment and Wage Statistics surveys. 2026–2026 figures are current estimates, and 2027 values are projections, calculated using a 2.46% CAGR derived from 7-year BLS historical data. Actual salaries may vary based on employer, experience, certifications, and local market conditions.
Salary by Experience Level
| Experience | Estimated Salary Range |
|---|---|
| 0-2 years (New Graduate) | $95,048 – $105,150 |
| 3-5 years (Mid Career) | $105,150 – $124,944 |
| 5+ years (Experienced) | $124,944 – $149,841 |
| 10+ years (Top Earner) | $149,841 – $163,045 |
PT salary ranges estimated from BLS percentile data. Individual physical therapist compensation varies by employer, certifications, and specialization.
Physical Therapist Job Market in Beaumont
Examining the local job market reveals that only nine physical therapists are employed in the Beaumont area, highlighting a relatively small workforce. The cost of living index, which stands at 113.1, indicates that living expenses are above the national average, which may impact the overall purchasing power for physical therapist pay in Beaumont, CA. In this environment, outpatient orthopedic clinics and hospital inpatient rehab facilities tend to offer the highest salaries. Factors such as productivity levels and specialized certifications (like OCS and SCS) can cause significant differences in pay, as clinics often reward high performers with bonuses and stipends. To maximize earning potential, therapists should focus on improving productivity, consider employment with facilities that provide lucrative productivity incentives, and explore opportunities within cash-pay models that can offer higher profit margins.
More salary data for Beaumont, CA:
Frequently Asked Questions
How much do physical therapists make in Beaumont, CA in 2026?
Is Beaumont, CA a good place to work as a physical therapist?
Can physical therapists make $100K in Beaumont?
What is the cost-of-living adjusted physical therapist salary in Beaumont?
How much does a physical therapist make per hour in Beaumont?
Related Pages
Compare Salaries
Career Resources
Nearby Cities in California
Written by Alex Morgan, DPT
Career Analyst
Alex Morgan has over 10 years of experience in physical therapy. They specialize in orthopedic rehabilitation. Alex works in a private practice setting.
Methodology & Data Source
Salary figures on this page are 2026 projections based on the Bureau of Labor Statistics Occupational Employment and Wage Statistics (OEWS) survey, May 2026 release. The BLS reported a median annual salary of $121,944 for physical therapistsin the Beaumont metropolitan area. A 2.46% compound annual growth rate (CAGR), calculated from 6-year national BLS wage trends, was applied to project current 2026 compensation. Percentile ranges (P10–P90) represent the full salary distribution across experience levels and practice settings in this market.
Data Sources & Methodology
Salary data for Beaumont is estimated from official BLS state-level occupational wage data (2025), adjusted for regional cost-of-living differences using BEA RPP (Regional Price Parities).
2026 figures are projected from 2025 BLS data using a compound annual growth rate (CAGR) of 2.46%, derived from historical BLS wage trends for physical therapists (SOC 29-1123).
Compiled and verified by Alex Morgan, DPT, a licensed physical therapist with 10+ years of clinical experience. · View source data at BLS.gov