Physical Therapist Salary in Fontana, CA: $133,711 (2026)
Quick Answer:A full-time physical therapist in Fontana, CA earns a median $133,711/year (≈ $64.28/hour) in nominal terms for 2026 — projected from BLS OEWS 2025 (SOC 29-1123). Once you factor in Fontana's price level (13% above national, BEA RPP 113.1), that paycheck buys what $118,224 would nationally. Nominal pay sits 4.0% above the California state average.
Based on BLS state-level estimates · View source
For physical therapists in Fontana, California, the 2026 median annual salary is projected to reach $133,711, reflecting a significant 27% increase over the national average of $105,288. With a salary range spanning from $92,799 at the 10th percentile to $181,727 at the 90th percentile, the earning potential is notable, particularly when productivity expectations within clinics are increasingly demanding. These numbers derive from estimates based on 2025 BLS data adjusted for regional cost factors, highlighting the market's competitive compensation. Given the pressures of visit frequency and units of service required daily, therapists in Fontana can expect that their pay is closely tied to their performance and efficiency in managing patient loads.
About the Fontana Market
Salary estimated from California average ($109,000) adjusted for local cost of living.
Salary Breakdown
| Percentile | Annual | Hourly |
|---|---|---|
| Entry Level (P10) | $92,799 | $44.61 |
| Lower Range (P25) | $106,384 | $51.15 |
| Median (P50)(typical) | $133,711 | $64.28 |
| Upper Range (P75) | $160,764 | $77.29 |
| Top Earners (P90) | $181,727 | $87.37 |
Median Salary Position
27.00% above the national average
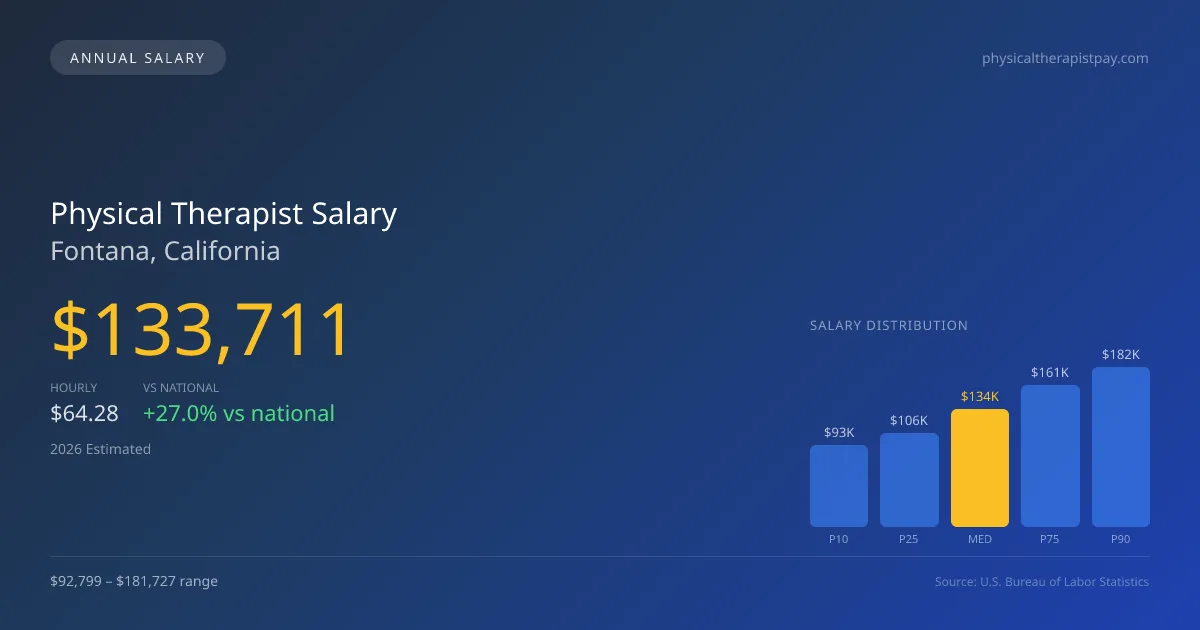
2026 Salary Percentile Distribution in Fontana
In Fontana, CA, the physical therapist salary spread from the 10th to 90th percentile is $88,928 (2026 est.). At $133,711, the local median is 27% above the national median of $105,288.
Salary Calculator
At 40 hours/week in Fontana: You'd be in the lower-middle range
How Fontana Physical Therapist Pay Compares
Fontana median: $133,711/year (2026)
| Compared To | Median Salary | Fontana Pays |
|---|---|---|
| California Average | $128,569 | +4.00% more |
| National Average | $105,288 | +27.00% more |
Physical Therapists in Fontana, CA earn a median of $133,711 per year (2026 est.), which is 27.00% higher than the national median of $105,288 and 4.00% above the California state average of $128,569.
Cost-of-Living Adjusted Salary
Fontana has a cost of living 13.10% above the national average.
Adjusted salary = nominal × (100 / CoL index). CoL index: 100 = national average.
Fontana, CA has a cost-of-living index of 113.1 (above the national average of 100). While the nominal salary of $133,711 is competitive, the higher cost of living reduces purchasing power to an effective $118,224 — a 11.58% reduction.
Compare Purchasing Power
Select a city to see how your salary compares after cost of living
Select a city above to compare purchasing power
2019 BLS Actual
$113,585
2025 BLS Actual
$130,501
2026 Current Est.
$133,711
2019–2027 Growth
+20.6%
Salary Trajectory for Physical Therapists in Fontana (2019–2027)
2019–2025: actual BLS OEWS data for this metro area. 2026+: CAGR 2.46% projection.
| Year | Annual Salary | Status |
|---|---|---|
| 2019 | $113,585 | Actual |
| 2020 | $115,579 | Actual |
| 2021 | $121,433 | Actual |
| 2022 | $124,100 | Actual |
| 2023 | $126,628 | Actual |
| 2024 | $128,201 | Actual |
| 2025 | $130,501 | Actual |
| 2026(current) | $133,711 | Estimated |
| 2027 | $137,001 | Projected |
Based on 7 years of BLS OEWS data for the Fontana metropolitan area, the median physical therapist salary grew 14.9% from $113,585 (2019) to $130,501 (2025). At a 2.46% compound annual growth rate, salaries are projected to reach $137,001 by 2027 — a total increase of $23,416 (20.62%) from 2019.
Note: Historical values (2019–2025) are actual BLS OEWS figures for the Fontana metropolitan area, sourced from annual Occupational Employment and Wage Statistics surveys. 2026–2026 figures are current estimates, and 2027 values are projections, calculated using a 2.46% CAGR derived from 7-year BLS historical data. Actual salaries may vary based on employer, experience, certifications, and local market conditions.
Salary by Experience Level
| Experience | Estimated Salary Range |
|---|---|
| 0-2 years (New Graduate) | $92,799 – $106,384 |
| 3-5 years (Mid Career) | $106,384 – $133,711 |
| 5+ years (Experienced) | $133,711 – $160,764 |
| 10+ years (Top Earner) | $160,764 – $181,727 |
PT salary ranges estimated from BLS percentile data. Individual physical therapist compensation varies by employer, certifications, and specialization.
Physical Therapist Job Market in Fontana
The local job market for physical therapists in Fontana currently employs about 32 professionals, indicating a steady demand for therapeutic services in the region. While the cost-of-living index stands at 113.1, showing that living expenses are higher than the national average, salary expectations should reflect this factor for take-home purchasing power. Facilities that generally offer higher pay include outpatient orthopedic clinics, particularly chains like ATI and Athletico, which often supplement compensation with performance-related bonuses. The disparity in pay can be attributed to various factors, including productivity expectations, advanced board certifications like OCS or SCS, and the dynamics of cash-pay versus insurance models. To maximize earning potential in Fontana, physical therapists should focus on maintaining a high volume of patient visits while considering opportunities in specialization and alternative practice models.
More salary data for Fontana, CA:
Frequently Asked Questions
How much do physical therapists make in Fontana, CA in 2026?
Is Fontana, CA a good place to work as a physical therapist?
Can physical therapists make $100K in Fontana?
What is the cost-of-living adjusted physical therapist salary in Fontana?
How much does a physical therapist make per hour in Fontana?
Related Pages
Compare Salaries
Career Resources
Nearby Cities in California
Written by Alex Morgan, DPT
Career Analyst
Alex Morgan has over 10 years of experience in physical therapy. They specialize in orthopedic rehabilitation. Alex works in a private practice setting.
Methodology & Data Source
Salary figures on this page are 2026 projections based on the Bureau of Labor Statistics Occupational Employment and Wage Statistics (OEWS) survey, May 2026 release. The BLS reported a median annual salary of $130,501 for physical therapistsin the Fontana metropolitan area. A 2.46% compound annual growth rate (CAGR), calculated from 6-year national BLS wage trends, was applied to project current 2026 compensation. Percentile ranges (P10–P90) represent the full salary distribution across experience levels and practice settings in this market.
Data Sources & Methodology
Salary data for Fontana is estimated from official BLS state-level occupational wage data (2025), adjusted for regional cost-of-living differences using BEA RPP (Regional Price Parities).
2026 figures are projected from 2025 BLS data using a compound annual growth rate (CAGR) of 2.46%, derived from historical BLS wage trends for physical therapists (SOC 29-1123).
Compiled and verified by Alex Morgan, DPT, a licensed physical therapist with 10+ years of clinical experience. · View source data at BLS.gov