Physical Therapist Salary in Hanford, CA: $130,596 (2026)
Quick Answer:A full-time physical therapist in Hanford, CA earns a median $130,596/year (≈ $62.79/hour) in nominal terms for 2026 — projected from BLS OEWS 2025 (SOC 29-1123). Once you factor in Hanford's price level (2% above national, BEA RPP 101.6), that paycheck buys what $128,524 would nationally. Nominal pay sits 1.6% above the California state average.
Official BLS data · View source
In 2026, physical therapist salaries in Hanford, California, reflect a promising landscape with a median annual pay of $130,596, significantly higher than the national median of $105,288, resulting in a notable increase of 24.04%. Earnings in the area can vary widely, with the salary range spanning from $85,605 at the 10th percentile to $149,335 at the 90th percentile. This data, derived from 2025 BLS OEWS surveys projected into 2026, highlights the competitive nature of the local job market and the expectations placed on physical therapists to maximize productivity through visits-per-day metrics. With substantial demand for rehab services in the community, Hanford's job market for physical therapists is robust, further emphasizing the significance of performance in determining compensation.
Salary Breakdown
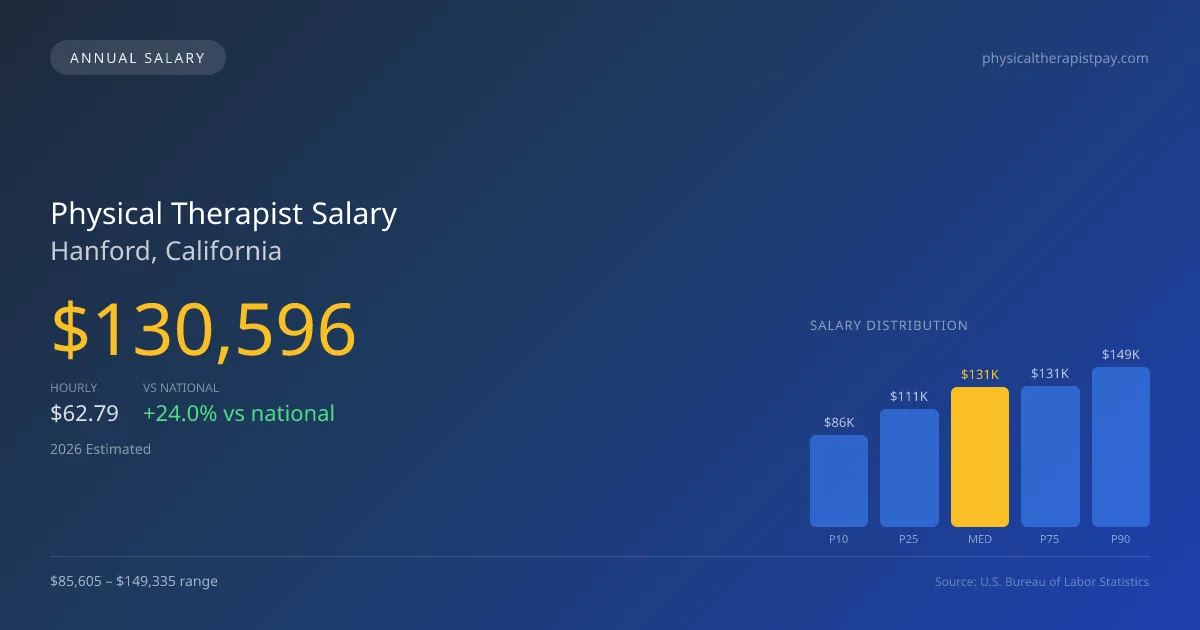
| Percentile | Annual | Hourly |
|---|---|---|
| Entry Level (P10) | $85,605 | $41.16 |
| Lower Range (P25) | $110,513 | $53.14 |
| Median (P50)(typical) | $130,596 | $62.79 |
| Upper Range (P75) | $131,436 | $63.19 |
| Top Earners (P90) | $149,335 | $71.79 |
Median Salary Position
24.04% above the national average
2026 Salary Percentile Distribution in Hanford
In Hanford, CA, the physical therapist salary spread from the 10th to 90th percentile is $63,730 (2026 est.). At $130,596, the local median is 24.04% above the national median of $105,288.
Salary Calculator
At 40 hours/week in Hanford: You'd be above the median
How Hanford Physical Therapist Pay Compares
Hanford median: $130,596/year (2026)
| Compared To | Median Salary | Hanford Pays |
|---|---|---|
| California Average | $128,539 | +1.60% more |
| National Average | $105,288 | +24.04% more |
Physical Therapists in Hanford, CA earn a median of $130,596 per year (2026 est.), which is 24.04% higher than the national median of $105,288 and 1.60% above the California state average of $128,539.
Cost-of-Living Adjusted Salary
Hanford has a cost of living 1.61% above the national average.
Adjusted salary = nominal × (100 / CoL index). CoL index: 100 = national average.
Hanford, CA has a cost-of-living index of 101.612 (above the national average of 100). While the nominal salary of $130,596 is competitive, the higher cost of living reduces purchasing power to an effective $128,524 — a 1.59% reduction.
Compare Purchasing Power
Select a city to see how your salary compares after cost of living
Select a city above to compare purchasing power
2019 BLS Actual
$110,938
2025 BLS Actual
$127,460
2026 Current Est.
$130,596
2019–2027 Growth
+20.6%
Salary Trajectory for Physical Therapists in Hanford (2019–2027)
2019–2025: actual BLS OEWS data for this metro area. 2026+: CAGR 2.46% projection.
| Year | Annual Salary | Status |
|---|---|---|
| 2019 | $110,938 | Actual |
| 2020 | $112,886 | Actual |
| 2021 | $118,604 | Actual |
| 2022 | $121,209 | Actual |
| 2023 | $111,610 | Actual |
| 2024 | $119,903 | Actual |
| 2025 | $127,460 | Actual |
| 2026(current) | $130,596 | Estimated |
| 2027 | $133,808 | Projected |
Based on 7 years of BLS OEWS data for the Hanford metropolitan area, the median physical therapist salary grew 14.9% from $110,938 (2019) to $127,460 (2025). At a 2.46% compound annual growth rate, salaries are projected to reach $133,808 by 2027 — a total increase of $22,870 (20.62%) from 2019.
Note: Historical values (2019–2025) are actual BLS OEWS figures for the Hanford metropolitan area, sourced from annual Occupational Employment and Wage Statistics surveys. 2026–2026 figures are current estimates, and 2027 values are projections, calculated using a 2.46% CAGR derived from 7-year BLS historical data. Actual salaries may vary based on employer, experience, certifications, and local market conditions.
Salary by Experience Level
| Experience | Estimated Salary Range |
|---|---|
| 0-2 years (New Graduate) | $85,605 – $110,513 |
| 3-5 years (Mid Career) | $110,513 – $130,596 |
| 5+ years (Experienced) | $130,596 – $131,436 |
| 10+ years (Top Earner) | $131,436 – $149,335 |
PT salary ranges estimated from BLS percentile data. Individual physical therapist compensation varies by employer, certifications, and specialization.
Physical Therapist Job Market in Hanford
Turning to the specifics of the job market, there are currently 40 physical therapists employed in Hanford, which should instill a sense of job security given the area's need for rehabilitation services. The cost-of-living index of 101.612 indicates that expenses in Hanford are slightly above the national average, creating a unique challenge for take-home purchasing power. Higher wages are often found in hospital inpatient rehab facilities or specialized outpatient clinics, such as those from national chains like ATI and Athletico, which might offer less base salary but incorporate bonuses tied to productivity. The pay disparity among employers can stem from factors like productivity expectations, board certifications such as OCS or SCS, and the type of practice model in place—cash-pay versus insurance. For therapists looking to optimize their earnings in Hanford, investing in additional certifications and exploring opportunities in higher-paying clinics can be strategic moves in a continually evolving market.
More salary data for Hanford, CA:
Frequently Asked Questions
How much do physical therapists make in Hanford, CA in 2026?
Is Hanford, CA a good place to work as a physical therapist?
Can physical therapists make $100K in Hanford?
What is the cost-of-living adjusted physical therapist salary in Hanford?
How much does a physical therapist make per hour in Hanford?
Related Pages
Compare Salaries
Career Resources
Nearby Cities in California
Written by Alex Morgan, DPT
Career Analyst
Alex Morgan has over 10 years of experience in physical therapy. They specialize in orthopedic rehabilitation. Alex works in a private practice setting.
Methodology & Data Source
Salary figures on this page are 2026 projections based on the Bureau of Labor Statistics Occupational Employment and Wage Statistics (OEWS) survey, May 2026 release. The BLS reported a median annual salary of $127,460 for physical therapistsin the Hanford metropolitan area. A 2.46% compound annual growth rate (CAGR), calculated from 6-year national BLS wage trends, was applied to project current 2026 compensation. Percentile ranges (P10–P90) represent the full salary distribution across experience levels and practice settings in this market.
Data Sources & Methodology
Source: BLS, OEWS, 3-year dataset (–). Per-city data from annual BLS metropolitan area surveys.
2026 figures are projected from 2025 BLS data using a compound annual growth rate (CAGR) of 2.46%, derived from historical BLS wage trends for physical therapists (SOC 29-1123).
Compiled and verified by Alex Morgan, DPT, a licensed physical therapist with 10+ years of clinical experience. · View source data at BLS.gov