Physical Therapist Salary in Montebello, CA: $127,398 (2026)
Quick Answer:A full-time physical therapist in Montebello, CA earns a median $127,398/year (≈ $61.25/hour) in nominal terms for 2026 — projected from BLS OEWS 2025 (SOC 29-1123). Once you factor in Montebello's price level (13% above national, BEA RPP 113.1), that paycheck buys what $112,642 would nationally. Nominal pay sits 0.9% below the California state average.
Based on BLS state-level estimates · View source
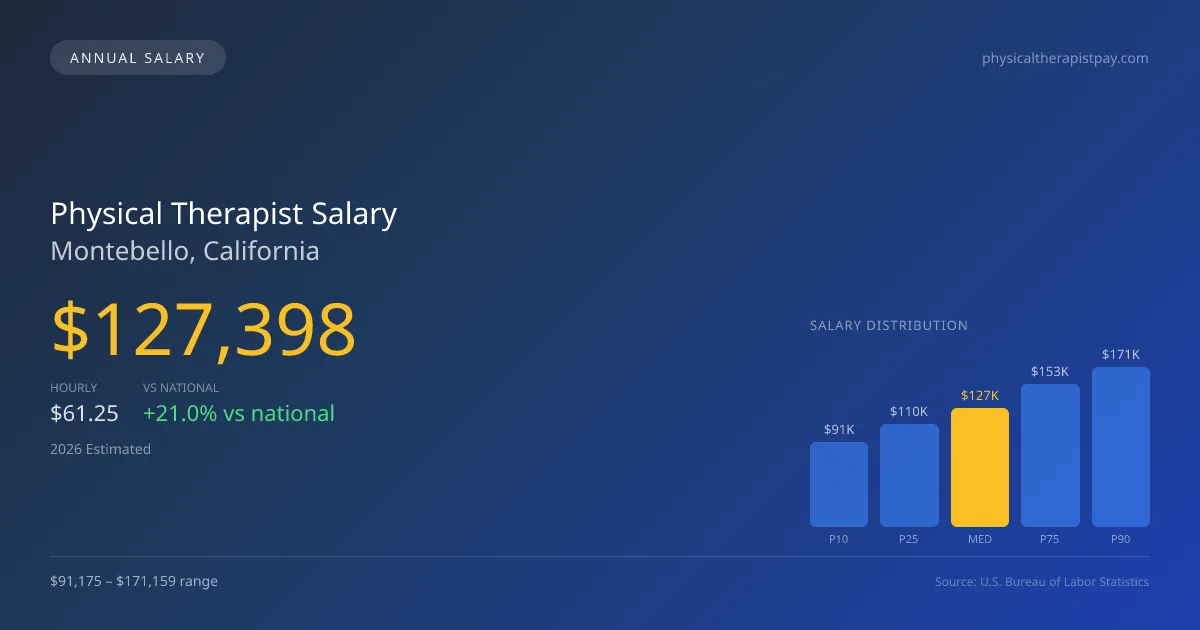
In Montebello, CA, physical therapists can expect a median annual salary of $127,398 for 2026, surpassing the national figure by 21%. The salary range for physical therapists here varies significantly, from $91,175 at the lower end to $171,159 at the higher end. These figures are based on estimates derived from 2025 BLS data, adjusted for regional cost considerations. The competitive compensation reflects not just the qualifications required but also the pressure on productivity that shapes earnings in the field. Therefore, understanding the local job market dynamics is essential for aspiring professionals.
About the Montebello Market
Salary estimated from California average ($109,000) adjusted for local cost of living.
Salary Breakdown
| Percentile | Annual | Hourly |
|---|---|---|
| Entry Level (P10) | $91,175 | $43.83 |
| Lower Range (P25) | $110,163 | $52.96 |
| Median (P50)(typical) | $127,398 | $61.25 |
| Upper Range (P75) | $152,943 | $73.53 |
| Top Earners (P90) | $171,159 | $82.29 |
Median Salary Position
21.00% above the national average
2026 Salary Percentile Distribution in Montebello
In Montebello, CA, the physical therapist salary spread from the 10th to 90th percentile is $79,984 (2026 est.). At $127,398, the local median is 21% above the national median of $105,288.
Salary Calculator
At 40 hours/week in Montebello: You'd be in the lower-middle range
How Montebello Physical Therapist Pay Compares
Montebello median: $127,398/year (2026)
| Compared To | Median Salary | Montebello Pays |
|---|---|---|
| California Average | $128,555 | -0.90% less |
| National Average | $105,288 | +21.00% more |
Physical Therapists in Montebello, CA earn a median of $127,398 per year (2026 est.), which is 21.00% higher than the national median of $105,288 and 0.90% below the California state average of $128,555.
Cost-of-Living Adjusted Salary
Montebello has a cost of living 13.10% above the national average.
Adjusted salary = nominal × (100 / CoL index). CoL index: 100 = national average.
Montebello, CA has a cost-of-living index of 113.1 (above the national average of 100). While the nominal salary of $127,398 is competitive, the higher cost of living reduces purchasing power to an effective $112,642 — a 11.58% reduction.
Compare Purchasing Power
Select a city to see how your salary compares after cost of living
Select a city above to compare purchasing power
2019 BLS Actual
$108,222
2025 BLS Actual
$124,339
2026 Current Est.
$127,398
2019–2027 Growth
+20.6%
Salary Trajectory for Physical Therapists in Montebello (2019–2027)
2019–2025: actual BLS OEWS data for this metro area. 2026+: CAGR 2.46% projection.
| Year | Annual Salary | Status |
|---|---|---|
| 2019 | $108,222 | Actual |
| 2020 | $110,122 | Actual |
| 2021 | $115,700 | Actual |
| 2022 | $118,241 | Actual |
| 2023 | $120,649 | Actual |
| 2024 | $122,149 | Actual |
| 2025 | $124,339 | Actual |
| 2026(current) | $127,398 | Estimated |
| 2027 | $130,532 | Projected |
Based on 7 years of BLS OEWS data for the Montebello metropolitan area, the median physical therapist salary grew 14.9% from $108,222 (2019) to $124,339 (2025). At a 2.46% compound annual growth rate, salaries are projected to reach $130,532 by 2027 — a total increase of $22,310 (20.62%) from 2019.
Note: Historical values (2019–2025) are actual BLS OEWS figures for the Montebello metropolitan area, sourced from annual Occupational Employment and Wage Statistics surveys. 2026–2026 figures are current estimates, and 2027 values are projections, calculated using a 2.46% CAGR derived from 7-year BLS historical data. Actual salaries may vary based on employer, experience, certifications, and local market conditions.
Salary by Experience Level
| Experience | Estimated Salary Range |
|---|---|
| 0-2 years (New Graduate) | $91,175 – $110,163 |
| 3-5 years (Mid Career) | $110,163 – $127,398 |
| 5+ years (Experienced) | $127,398 – $152,943 |
| 10+ years (Top Earner) | $152,943 – $171,159 |
PT salary ranges estimated from BLS percentile data. Individual physical therapist compensation varies by employer, certifications, and specialization.
Physical Therapist Job Market in Montebello
The job market for physical therapists in Montebello is relatively small, with only 16 practitioners currently employed. This limited workforce presents both opportunities and challenges in terms of pay and employment stability. With a cost of living index of 113.1, professionals must be mindful of how it impacts their overall purchasing power. Salaries can vary greatly depending on the setting; outpatient orthopedic clinics often offer competitive compensation and bonuses based on productivity, while hospital-based positions may provide higher base pay but come with different expectations. The discrepancy between the lower and upper pay scales can be driven by factors such as productivity targets, specialization certifications like OCS and SCS, clinic ownership equity, and whether therapists are in cash-pay models versus insurance-based practices. For those looking to maximize their earning potential, pursuing board certifications, maintaining high productivity, and targeting employers with strong reputations in reimbursement practices are prudent strategies.
More salary data for Montebello, CA:
Frequently Asked Questions
How much do physical therapists make in Montebello, CA in 2026?
Is Montebello, CA a good place to work as a physical therapist?
Can physical therapists make $100K in Montebello?
What is the cost-of-living adjusted physical therapist salary in Montebello?
How much does a physical therapist make per hour in Montebello?
Related Pages
Compare Salaries
Career Resources
Nearby Cities in California
Written by Alex Morgan, DPT
Career Analyst
Alex Morgan has over 10 years of experience in physical therapy. They specialize in orthopedic rehabilitation. Alex works in a private practice setting.
Methodology & Data Source
Salary figures on this page are 2026 projections based on the Bureau of Labor Statistics Occupational Employment and Wage Statistics (OEWS) survey, May 2026 release. The BLS reported a median annual salary of $124,339 for physical therapistsin the Montebello metropolitan area. A 2.46% compound annual growth rate (CAGR), calculated from 6-year national BLS wage trends, was applied to project current 2026 compensation. Percentile ranges (P10–P90) represent the full salary distribution across experience levels and practice settings in this market.
Data Sources & Methodology
Salary data for Montebello is estimated from official BLS state-level occupational wage data (2025), adjusted for regional cost-of-living differences using BEA RPP (Regional Price Parities).
2026 figures are projected from 2025 BLS data using a compound annual growth rate (CAGR) of 2.46%, derived from historical BLS wage trends for physical therapists (SOC 29-1123).
Compiled and verified by Alex Morgan, DPT, a licensed physical therapist with 10+ years of clinical experience. · View source data at BLS.gov