Physical Therapist Salary in Oceanside, CA: $130,501 (2026)
Quick Answer:A full-time physical therapist in Oceanside, CA earns a median $130,501/year (≈ $62.74/hour) in nominal terms for 2026 — projected from BLS OEWS 2025 (SOC 29-1123). Once you factor in Oceanside's price level (13% above national, BEA RPP 113.1), that paycheck buys what $115,385 would nationally. Nominal pay sits 1.5% above the California state average.
Based on BLS state-level estimates · View source
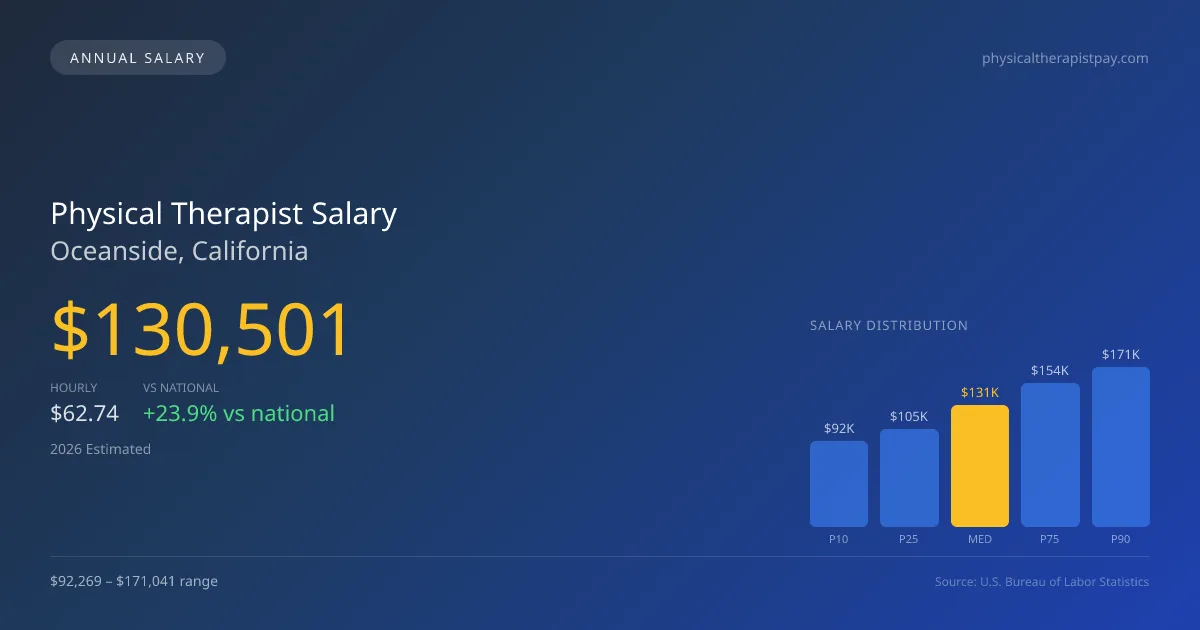
In Oceanside, California, the physical therapist salary is projected to reach a median of $130,501 in 2026, reflecting a robust trend influenced by the demand for cash-pay specialty services in sports and orthopedic therapy. The salary spectrum ranges from $92,269 at the lower end (P10) to an impressive $171,041 at the upper tier (P90). These figures are derived from estimates based on 2025 BLS data and adjust for local cost-of-living factors, providing a context that further highlights the earning potential for physical therapists in the area. As competition increases among outpatient clinics and rehabilitative facilities, professionals in Oceanside have the opportunity to maximize their income through niche practice areas and specialized certifications.
About the Oceanside Market
Salary estimated from California average ($109,000) adjusted for local cost of living.
Salary Breakdown
| Percentile | Annual | Hourly |
|---|---|---|
| Entry Level (P10) | $92,269 | $44.37 |
| Lower Range (P25) | $104,615 | $50.30 |
| Median (P50)(typical) | $130,501 | $62.74 |
| Upper Range (P75) | $153,900 | $73.99 |
| Top Earners (P90) | $171,041 | $82.23 |
Median Salary Position
23.95% above the national average
2026 Salary Percentile Distribution in Oceanside
In Oceanside, CA, the physical therapist salary spread from the 10th to 90th percentile is $78,772 (2026 est.). At $130,501, the local median is 23.95% above the national median of $105,288.
Salary Calculator
At 40 hours/week in Oceanside: You'd be in the lower-middle range
How Oceanside Physical Therapist Pay Compares
Oceanside median: $130,501/year (2026)
| Compared To | Median Salary | Oceanside Pays |
|---|---|---|
| California Average | $128,573 | +1.50% more |
| National Average | $105,288 | +23.95% more |
Physical Therapists in Oceanside, CA earn a median of $130,501 per year (2026 est.), which is 23.95% higher than the national median of $105,288 and 1.50% above the California state average of $128,573.
Cost-of-Living Adjusted Salary
Oceanside has a cost of living 13.10% above the national average.
Adjusted salary = nominal × (100 / CoL index). CoL index: 100 = national average.
Oceanside, CA has a cost-of-living index of 113.1 (above the national average of 100). While the nominal salary of $130,501 is competitive, the higher cost of living reduces purchasing power to an effective $115,385 — a 11.58% reduction.
Compare Purchasing Power
Select a city to see how your salary compares after cost of living
Select a city above to compare purchasing power
2019 BLS Actual
$110,858
2025 BLS Actual
$127,368
2026 Current Est.
$130,501
2019–2027 Growth
+20.6%
Salary Trajectory for Physical Therapists in Oceanside (2019–2027)
2019–2025: actual BLS OEWS data for this metro area. 2026+: CAGR 2.46% projection.
| Year | Annual Salary | Status |
|---|---|---|
| 2019 | $110,858 | Actual |
| 2020 | $112,804 | Actual |
| 2021 | $118,518 | Actual |
| 2022 | $121,121 | Actual |
| 2023 | $123,588 | Actual |
| 2024 | $125,124 | Actual |
| 2025 | $127,368 | Actual |
| 2026(current) | $130,501 | Estimated |
| 2027 | $133,712 | Projected |
Based on 7 years of BLS OEWS data for the Oceanside metropolitan area, the median physical therapist salary grew 14.9% from $110,858 (2019) to $127,368 (2025). At a 2.46% compound annual growth rate, salaries are projected to reach $133,712 by 2027 — a total increase of $22,854 (20.62%) from 2019.
Note: Historical values (2019–2025) are actual BLS OEWS figures for the Oceanside metropolitan area, sourced from annual Occupational Employment and Wage Statistics surveys. 2026–2026 figures are current estimates, and 2027 values are projections, calculated using a 2.46% CAGR derived from 7-year BLS historical data. Actual salaries may vary based on employer, experience, certifications, and local market conditions.
Salary by Experience Level
| Experience | Estimated Salary Range |
|---|---|
| 0-2 years (New Graduate) | $92,269 – $104,615 |
| 3-5 years (Mid Career) | $104,615 – $130,501 |
| 5+ years (Experienced) | $130,501 – $153,900 |
| 10+ years (Top Earner) | $153,900 – $171,041 |
PT salary ranges estimated from BLS percentile data. Individual physical therapist compensation varies by employer, certifications, and specialization.
Physical Therapist Job Market in Oceanside
The job market in Oceanside currently employs 28 physical therapists, indicating a steady demand in this tranquil coastal city. However, the cost of living index stands at 113.1, suggesting that while salaries may appear competitive, the local purchasing power might be constrained. Outpatient orthopedic clinics often offer the highest salaries in this region, particularly those with cash-pay models that are appealing to patients seeking immediate care without insurance limitations. Factors contributing to the pay disparity include productivity expectations—how many patients therapists see in a day—and advanced board certifications like OCS or SCS, which can enhance earning capacity. To boost pay, therapists might consider engaging in business-owning, pursuing continuing education for specialty certifications, or entering cash-based practice settings that allow for higher revenue potential and flexibility in patient treatment plans.
More salary data for Oceanside, CA:
Frequently Asked Questions
How much do physical therapists make in Oceanside, CA in 2026?
Is Oceanside, CA a good place to work as a physical therapist?
Can physical therapists make $100K in Oceanside?
What is the cost-of-living adjusted physical therapist salary in Oceanside?
How much does a physical therapist make per hour in Oceanside?
Related Pages
Compare Salaries
Career Resources
Nearby Cities in California
Written by Alex Morgan, DPT
Career Analyst
Alex Morgan has over 10 years of experience in physical therapy. They specialize in orthopedic rehabilitation. Alex works in a private practice setting.
Methodology & Data Source
Salary figures on this page are 2026 projections based on the Bureau of Labor Statistics Occupational Employment and Wage Statistics (OEWS) survey, May 2026 release. The BLS reported a median annual salary of $127,368 for physical therapistsin the Oceanside metropolitan area. A 2.46% compound annual growth rate (CAGR), calculated from 6-year national BLS wage trends, was applied to project current 2026 compensation. Percentile ranges (P10–P90) represent the full salary distribution across experience levels and practice settings in this market.
Data Sources & Methodology
Salary data for Oceanside is estimated from official BLS state-level occupational wage data (2025), adjusted for regional cost-of-living differences using BEA RPP (Regional Price Parities).
2026 figures are projected from 2025 BLS data using a compound annual growth rate (CAGR) of 2.46%, derived from historical BLS wage trends for physical therapists (SOC 29-1123).
Compiled and verified by Alex Morgan, DPT, a licensed physical therapist with 10+ years of clinical experience. · View source data at BLS.gov