Physical Therapist Salary in Petaluma, CA: $142,175 (2026)
Quick Answer:A full-time physical therapist in Petaluma, CA earns a median $142,175/year (≈ $68.35/hour) in nominal terms for 2026 — projected from BLS OEWS 2025 (SOC 29-1123). Once you factor in Petaluma's price level (13% above national, BEA RPP 113.1), that paycheck buys what $125,707 would nationally. Nominal pay sits 10.6% above the California state average.
Based on BLS state-level estimates · View source
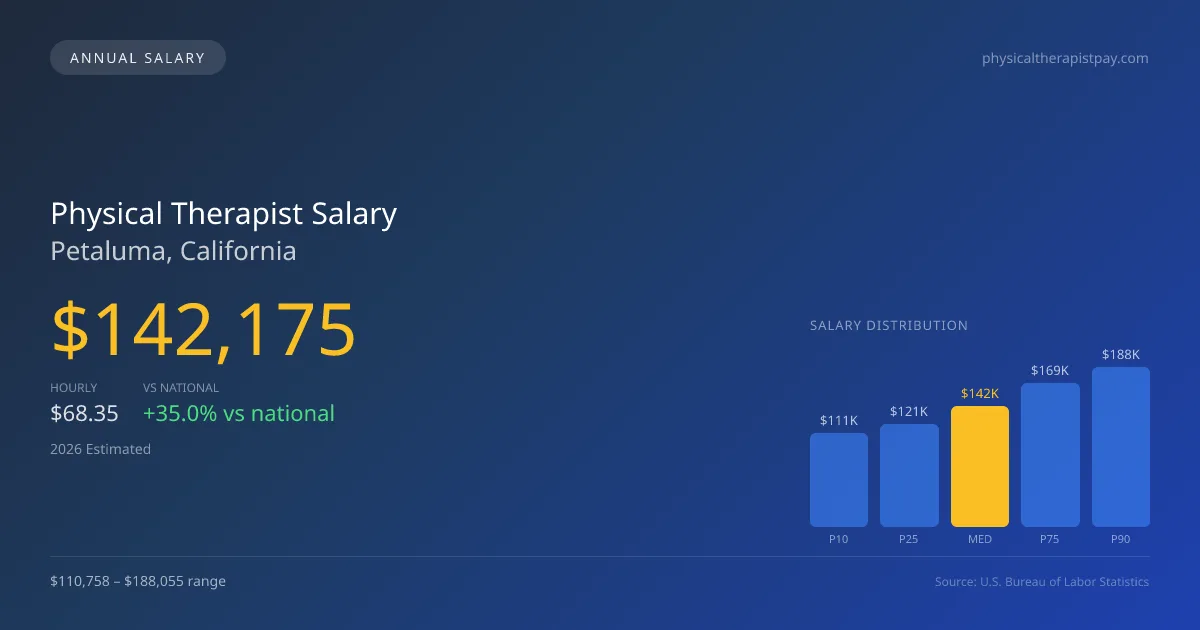
Physical therapists in Petaluma, CA, can expect a promising median annual salary of $142,175 in 2026, significantly surpassing the national median of $105,288. The salary range varies widely, from $110,758 at the 10th percentile to $188,055 at the 90th percentile. These figures are based on 2025 BLS Occupational Employment and Wage Statistics (OEWS) data, projected to 2026, and reflect local market conditions adjusted for regional price disparities. Job seekers should consider that outpatient orthopedic clinics typically offer different pay structures compared to hospitals and skilled nursing facilities, creating distinct opportunities based on these structural choices in the employment landscape of Petaluma.
About the Petaluma Market
Salary estimated from California average ($109,000) adjusted for local cost of living.
Salary Breakdown
| Percentile | Annual | Hourly |
|---|---|---|
| Entry Level (P10) | $110,758 | $53.25 |
| Lower Range (P25) | $121,166 | $58.25 |
| Median (P50)(typical) | $142,175 | $68.35 |
| Upper Range (P75) | $168,908 | $81.21 |
| Top Earners (P90) | $188,055 | $90.41 |
Median Salary Position
35.03% above the national average
2026 Salary Percentile Distribution in Petaluma
In Petaluma, CA, the physical therapist salary spread from the 10th to 90th percentile is $77,297 (2026 est.). At $142,175, the local median is 35.03% above the national median of $105,288.
Salary Calculator
At 40 hours/week in Petaluma: You'd be in the lower-middle range
How Petaluma Physical Therapist Pay Compares
Petaluma median: $142,175/year (2026)
| Compared To | Median Salary | Petaluma Pays |
|---|---|---|
| California Average | $128,548 | +10.60% more |
| National Average | $105,288 | +35.03% more |
Physical Therapists in Petaluma, CA earn a median of $142,175 per year (2026 est.), which is 35.03% higher than the national median of $105,288 and 10.60% above the California state average of $128,548.
Cost-of-Living Adjusted Salary
Petaluma has a cost of living 13.10% above the national average.
Adjusted salary = nominal × (100 / CoL index). CoL index: 100 = national average.
Petaluma, CA has a cost-of-living index of 113.1 (above the national average of 100). While the nominal salary of $142,175 is competitive, the higher cost of living reduces purchasing power to an effective $125,707 — a 11.58% reduction.
Compare Purchasing Power
Select a city to see how your salary compares after cost of living
Select a city above to compare purchasing power
2019 BLS Actual
$120,774
2025 BLS Actual
$138,761
2026 Current Est.
$142,175
2019–2027 Growth
+20.6%
Salary Trajectory for Physical Therapists in Petaluma (2019–2027)
2019–2025: actual BLS OEWS data for this metro area. 2026+: CAGR 2.46% projection.
| Year | Annual Salary | Status |
|---|---|---|
| 2019 | $120,774 | Actual |
| 2020 | $122,894 | Actual |
| 2021 | $129,120 | Actual |
| 2022 | $131,955 | Actual |
| 2023 | $134,642 | Actual |
| 2024 | $120,879 | Actual |
| 2025 | $138,761 | Actual |
| 2026(current) | $142,175 | Estimated |
| 2027 | $145,672 | Projected |
Based on 7 years of BLS OEWS data for the Petaluma metropolitan area, the median physical therapist salary grew 14.9% from $120,774 (2019) to $138,761 (2025). At a 2.46% compound annual growth rate, salaries are projected to reach $145,672 by 2027 — a total increase of $24,898 (20.62%) from 2019.
Note: Historical values (2019–2025) are actual BLS OEWS figures for the Petaluma metropolitan area, sourced from annual Occupational Employment and Wage Statistics surveys. 2026–2026 figures are current estimates, and 2027 values are projections, calculated using a 2.46% CAGR derived from 7-year BLS historical data. Actual salaries may vary based on employer, experience, certifications, and local market conditions.
Salary by Experience Level
| Experience | Estimated Salary Range |
|---|---|
| 0-2 years (New Graduate) | $110,758 – $121,166 |
| 3-5 years (Mid Career) | $121,166 – $142,175 |
| 5+ years (Experienced) | $142,175 – $168,908 |
| 10+ years (Top Earner) | $168,908 – $188,055 |
PT salary ranges estimated from BLS percentile data. Individual physical therapist compensation varies by employer, certifications, and specialization.
Physical Therapist Job Market in Petaluma
The job market for physical therapists in Petaluma remains robust, with 12 professionals currently employed in the area. However, the cost of living, with an index of 113.1, significantly impacts take-home pay and purchasing power. Within this market, outpatient clinics might offer less base salary than hospital systems but can provide bonuses for high productivity, especially as reimbursement pressures increase. Facilities that prioritize board-certified specialists, such as those with Orthopedic Clinical Specialist (OCS) or Sports Clinical Specialist (SCS) certifications, may also provide higher compensation. To maximize earnings, therapists should focus on increasing their productivity, exploring cash-pay models, and considering roles in higher-paying settings like sports medicine or travel PT agencies that offer premiums for flexibility and experienced staff.
More salary data for Petaluma, CA:
Frequently Asked Questions
How much do physical therapists make in Petaluma, CA in 2026?
Is Petaluma, CA a good place to work as a physical therapist?
Can physical therapists make $100K in Petaluma?
What is the cost-of-living adjusted physical therapist salary in Petaluma?
How much does a physical therapist make per hour in Petaluma?
Related Pages
Compare Salaries
Career Resources
Nearby Cities in California
Written by Alex Morgan, DPT
Career Analyst
Alex Morgan has over 10 years of experience in physical therapy. They specialize in orthopedic rehabilitation. Alex works in a private practice setting.
Methodology & Data Source
Salary figures on this page are 2026 projections based on the Bureau of Labor Statistics Occupational Employment and Wage Statistics (OEWS) survey, May 2026 release. The BLS reported a median annual salary of $138,761 for physical therapistsin the Petaluma metropolitan area. A 2.46% compound annual growth rate (CAGR), calculated from 6-year national BLS wage trends, was applied to project current 2026 compensation. Percentile ranges (P10–P90) represent the full salary distribution across experience levels and practice settings in this market.
Data Sources & Methodology
Salary data for Petaluma is estimated from official BLS state-level occupational wage data (2025), adjusted for regional cost-of-living differences using BEA RPP (Regional Price Parities).
2026 figures are projected from 2025 BLS data using a compound annual growth rate (CAGR) of 2.46%, derived from historical BLS wage trends for physical therapists (SOC 29-1123).
Compiled and verified by Alex Morgan, DPT, a licensed physical therapist with 10+ years of clinical experience. · View source data at BLS.gov