Physical Therapist Salary in Temecula, CA: $131,457 (2026)
Quick Answer:A full-time physical therapist in Temecula, CA earns a median $131,457/year (≈ $63.20/hour) in nominal terms for 2026 — projected from BLS OEWS 2025 (SOC 29-1123). Once you factor in Temecula's price level (13% above national, BEA RPP 113.1), that paycheck buys what $116,231 would nationally. Nominal pay sits 2.2% above the California state average.
Based on BLS state-level estimates · View source
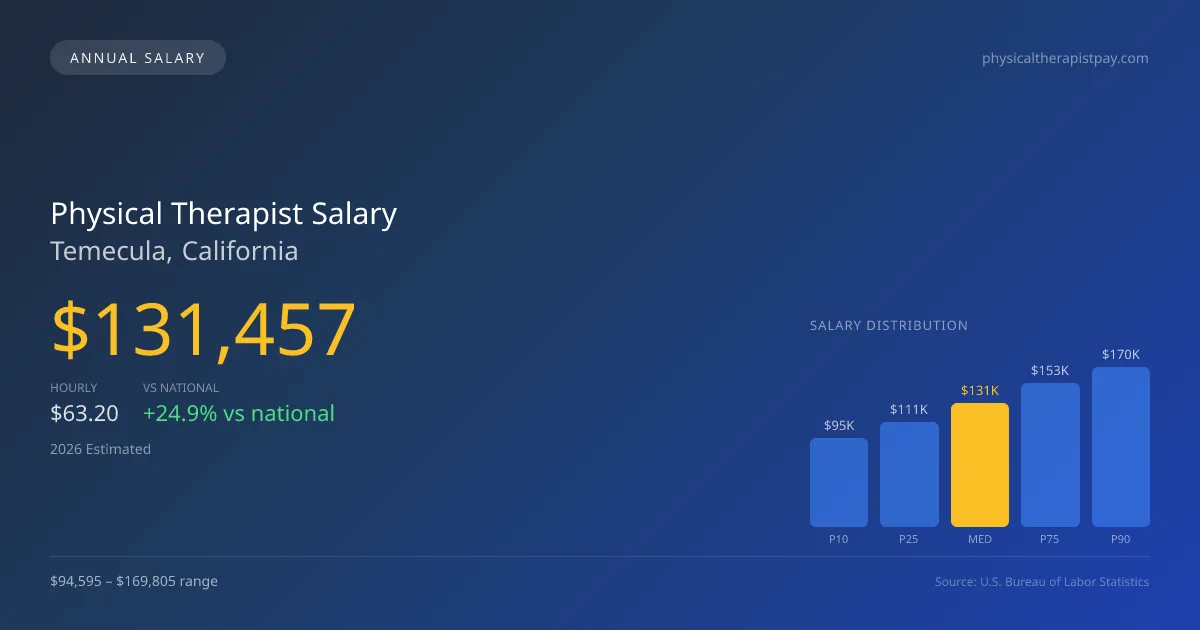
In 2026, physical therapists in Temecula, California, command a median annual salary of $131,457, reflecting a notable 24.85% premium over the national median of $105,288. The compensation for physical therapists in this region spans from $94,595 at the 10th percentile to as much as $169,805 at the 90th percentile. These figures are derived from estimates based on 2025 BLS data, adjusted for local cost factors. With productivity expectations driving the market, therapists feel pressure to maximize visits per day, further influencing effective hourly compensation rates, which are currently pegged at a median of $63.20. This dynamic pay structure can provide an attractive incentive for skilled professionals to consider a career in Temecula.
About the Temecula Market
Salary estimated from California average ($109,000) adjusted for local cost of living.
Salary Breakdown
| Percentile | Annual | Hourly |
|---|---|---|
| Entry Level (P10) | $94,595 | $45.48 |
| Lower Range (P25) | $111,491 | $53.60 |
| Median (P50)(typical) | $131,457 | $63.20 |
| Upper Range (P75) | $153,243 | $73.68 |
| Top Earners (P90) | $169,805 | $81.64 |
Median Salary Position
24.85% above the national average
2026 Salary Percentile Distribution in Temecula
In Temecula, CA, the physical therapist salary spread from the 10th to 90th percentile is $75,210 (2026 est.). At $131,457, the local median is 24.85% above the national median of $105,288.
Salary Calculator
At 40 hours/week in Temecula: You'd be in the lower-middle range
How Temecula Physical Therapist Pay Compares
Temecula median: $131,457/year (2026)
| Compared To | Median Salary | Temecula Pays |
|---|---|---|
| California Average | $128,627 | +2.20% more |
| National Average | $105,288 | +24.85% more |
Physical Therapists in Temecula, CA earn a median of $131,457 per year (2026 est.), which is 24.85% higher than the national median of $105,288 and 2.20% above the California state average of $128,627.
Cost-of-Living Adjusted Salary
Temecula has a cost of living 13.10% above the national average.
Adjusted salary = nominal × (100 / CoL index). CoL index: 100 = national average.
Temecula, CA has a cost-of-living index of 113.1 (above the national average of 100). While the nominal salary of $131,457 is competitive, the higher cost of living reduces purchasing power to an effective $116,231 — a 11.58% reduction.
Compare Purchasing Power
Select a city to see how your salary compares after cost of living
Select a city above to compare purchasing power
2019 BLS Actual
$111,670
2025 BLS Actual
$128,301
2026 Current Est.
$131,457
2019–2027 Growth
+20.6%
Salary Trajectory for Physical Therapists in Temecula (2019–2027)
2019–2025: actual BLS OEWS data for this metro area. 2026+: CAGR 2.46% projection.
| Year | Annual Salary | Status |
|---|---|---|
| 2019 | $111,670 | Actual |
| 2020 | $113,631 | Actual |
| 2021 | $119,386 | Actual |
| 2022 | $122,008 | Actual |
| 2023 | $124,493 | Actual |
| 2024 | $126,041 | Actual |
| 2025 | $128,301 | Actual |
| 2026(current) | $131,457 | Estimated |
| 2027 | $134,691 | Projected |
Based on 7 years of BLS OEWS data for the Temecula metropolitan area, the median physical therapist salary grew 14.9% from $111,670 (2019) to $128,301 (2025). At a 2.46% compound annual growth rate, salaries are projected to reach $134,691 by 2027 — a total increase of $23,021 (20.62%) from 2019.
Note: Historical values (2019–2025) are actual BLS OEWS figures for the Temecula metropolitan area, sourced from annual Occupational Employment and Wage Statistics surveys. 2026–2026 figures are current estimates, and 2027 values are projections, calculated using a 2.46% CAGR derived from 7-year BLS historical data. Actual salaries may vary based on employer, experience, certifications, and local market conditions.
Salary by Experience Level
| Experience | Estimated Salary Range |
|---|---|
| 0-2 years (New Graduate) | $94,595 – $111,491 |
| 3-5 years (Mid Career) | $111,491 – $131,457 |
| 5+ years (Experienced) | $131,457 – $153,243 |
| 10+ years (Top Earner) | $153,243 – $169,805 |
PT salary ranges estimated from BLS percentile data. Individual physical therapist compensation varies by employer, certifications, and specialization.
Physical Therapist Job Market in Temecula
The local job market consists of 25 employed physical therapists, indicating a competitive environment where opportunities may vary based on practice settings. With a cost-of-living index of 113.1, the financial landscape also affects take-home purchasing power, making it crucial for professionals to assess job offers critically. Outpatient orthopedic clinics such as ATI or Athletico often lead in compensation, although local hospital systems may offer higher salaries alongside advantageous benefit packages. Factors influencing wage disparities include productivity expectations, optional board certification stipends, and variations between cash-pay and insurance-based models. To maximize earnings in this specific market, physical therapists should consider specializing further, seeking administrative roles, or exploring travel opportunities, which can offer additional salary premiums in a competitive COl environment.
More salary data for Temecula, CA:
Frequently Asked Questions
How much do physical therapists make in Temecula, CA in 2026?
Is Temecula, CA a good place to work as a physical therapist?
Can physical therapists make $100K in Temecula?
What is the cost-of-living adjusted physical therapist salary in Temecula?
How much does a physical therapist make per hour in Temecula?
Related Pages
Compare Salaries
Career Resources
Nearby Cities in California
Written by Alex Morgan, DPT
Career Analyst
Alex Morgan has over 10 years of experience in physical therapy. They specialize in orthopedic rehabilitation. Alex works in a private practice setting.
Methodology & Data Source
Salary figures on this page are 2026 projections based on the Bureau of Labor Statistics Occupational Employment and Wage Statistics (OEWS) survey, May 2026 release. The BLS reported a median annual salary of $128,301 for physical therapistsin the Temecula metropolitan area. A 2.46% compound annual growth rate (CAGR), calculated from 6-year national BLS wage trends, was applied to project current 2026 compensation. Percentile ranges (P10–P90) represent the full salary distribution across experience levels and practice settings in this market.
Data Sources & Methodology
Salary data for Temecula is estimated from official BLS state-level occupational wage data (2025), adjusted for regional cost-of-living differences using BEA RPP (Regional Price Parities).
2026 figures are projected from 2025 BLS data using a compound annual growth rate (CAGR) of 2.46%, derived from historical BLS wage trends for physical therapists (SOC 29-1123).
Compiled and verified by Alex Morgan, DPT, a licensed physical therapist with 10+ years of clinical experience. · View source data at BLS.gov