Physical Therapist Salary in Vallejo, CA: $145,012 (2026)
Quick Answer:A full-time physical therapist in Vallejo, CA earns a median $145,012/year (≈ $69.71/hour) in nominal terms for 2026 — projected from BLS OEWS 2025 (SOC 29-1123). Once you factor in Vallejo's price level (8% above national, BEA RPP 108.5), that paycheck buys what $133,677 would nationally. Nominal pay sits 12.8% above the California state average.
Official BLS data · View source
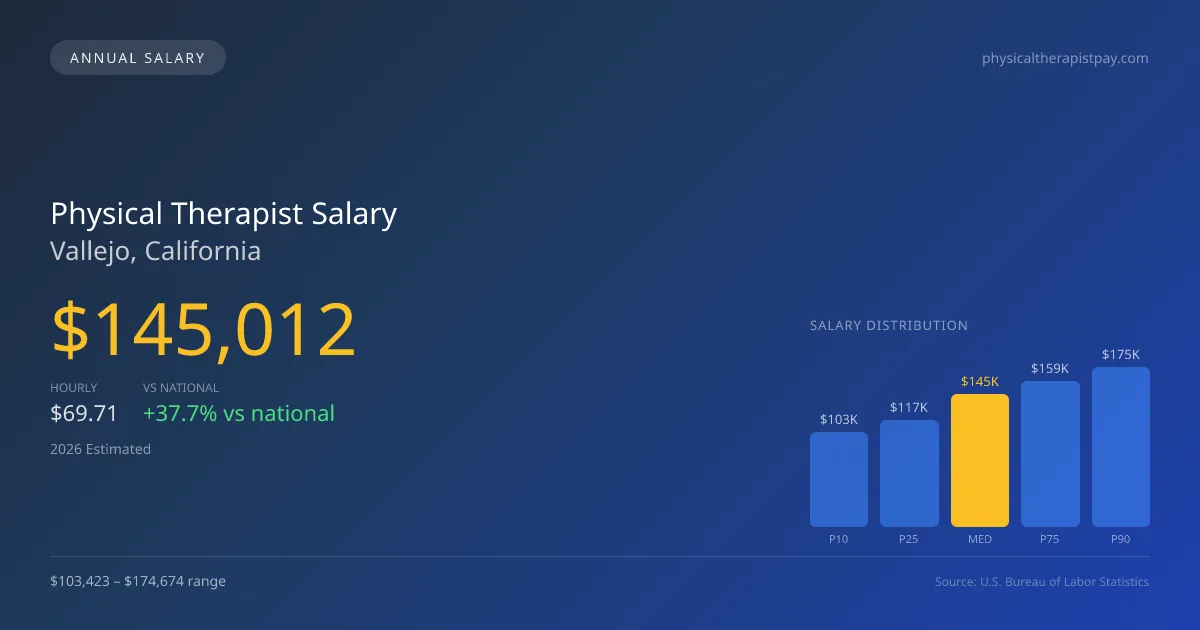
In 2026, physical therapists in Vallejo, California, are projected to earn a median annual salary of $145,012, significantly surpassing the national median of $105,288 by 37.73%. The salary range reflects robust opportunities in the local market, with entry-level positions starting around $103,423 and top earners reaching up to $174,674. These figures, derived from 2025 BLS OEWS surveys, highlight the demand for specialized practitioners, particularly in cash-pay sports and orthopedic settings, which have had a notable impact on higher-end compensation. Professionals in Vallejo benefit from a vibrant job market that values advanced skills and specialization, further enhancing the attractiveness of this career path.
Salary Breakdown
| Percentile | Annual | Hourly |
|---|---|---|
| Entry Level (P10) | $103,423 | $49.72 |
| Lower Range (P25) | $117,009 | $56.26 |
| Median (P50)(typical) | $145,012 | $69.71 |
| Upper Range (P75) | $158,977 | $76.44 |
| Top Earners (P90) | $174,674 | $83.98 |
Median Salary Position
37.73% above the national average
2026 Salary Percentile Distribution in Vallejo
In Vallejo, CA, the physical therapist salary spread from the 10th to 90th percentile is $71,251 (2026 est.). At $145,012, the local median is 37.73% above the national median of $105,288.
Salary Calculator
At 40 hours/week in Vallejo: You'd be above the median
How Vallejo Physical Therapist Pay Compares
Vallejo median: $145,012/year (2026)
| Compared To | Median Salary | Vallejo Pays |
|---|---|---|
| California Average | $128,556 | +12.80% more |
| National Average | $105,288 | +37.73% more |
Physical Therapists in Vallejo, CA earn a median of $145,012 per year (2026 est.), which is 37.73% higher than the national median of $105,288 and 12.80% above the California state average of $128,556.
Cost-of-Living Adjusted Salary
Vallejo has a cost of living 8.48% above the national average.
Adjusted salary = nominal × (100 / CoL index). CoL index: 100 = national average.
Vallejo, CA has a cost-of-living index of 108.479 (above the national average of 100). While the nominal salary of $145,012 is competitive, the higher cost of living reduces purchasing power to an effective $133,677 — a 7.82% reduction.
Compare Purchasing Power
Select a city to see how your salary compares after cost of living
Select a city above to compare purchasing power
2019 BLS Actual
$108,230
2025 BLS Actual
$141,530
2026 Current Est.
$145,012
2019–2027 Growth
+37.3%
Salary Trajectory for Physical Therapists in Vallejo (2019–2027)
2019–2025: actual BLS OEWS data for this metro area. 2026+: CAGR 2.46% projection.
| Year | Annual Salary | Status |
|---|---|---|
| 2019 | $108,230 | Actual |
| 2020 | $113,520 | Actual |
| 2021 | $103,460 | Actual |
| 2022 | $118,070 | Actual |
| 2023 | $123,410 | Actual |
| 2024 | $136,440 | Actual |
| 2025 | $141,530 | Actual |
| 2026(current) | $145,012 | Estimated |
| 2027 | $148,579 | Projected |
Based on 7 years of BLS OEWS data for the Vallejo metropolitan area, the median physical therapist salary grew 30.8% from $108,230 (2019) to $141,530 (2025). At a 2.46% compound annual growth rate, salaries are projected to reach $148,579 by 2027 — a total increase of $40,349 (37.28%) from 2019.
Note: Historical values (2019–2025) are actual BLS OEWS figures for the Vallejo metropolitan area, sourced from annual Occupational Employment and Wage Statistics surveys. 2026–2026 figures are current estimates, and 2027 values are projections, calculated using a 2.46% CAGR derived from 7-year BLS historical data. Actual salaries may vary based on employer, experience, certifications, and local market conditions.
Salary by Experience Level
| Experience | Estimated Salary Range |
|---|---|
| 0-2 years (New Graduate) | $103,423 – $117,009 |
| 3-5 years (Mid Career) | $117,009 – $145,012 |
| 5+ years (Experienced) | $145,012 – $158,977 |
| 10+ years (Top Earner) | $158,977 – $174,674 |
PT salary ranges estimated from BLS percentile data. Individual physical therapist compensation varies by employer, certifications, and specialization.
Physical Therapist Job Market in Vallejo
The employment landscape for physical therapists in Vallejo is strong, with approximately 300 local professionals serving the community. However, the cost of living index stands at 108.479, indicating that living expenses are above the national average, which can affect take-home pay. Outpatient orthopedic clinics, such as ATI and Athletico, typically offer competitive salaries coupled with productivity bonuses, while hospital systems may provide higher base compensation but with different productivity expectations. The variation in pay often stems from factors like clinic ownership equity, board certifications such as OCS and SCS, and the growing trend toward cash-pay models versus traditional insurance practices. For those looking to maximize their earnings in Vallejo, pursuing board certification, engaging in networking opportunities, and considering employment with high-paying employers could prove beneficial strategies in this dynamic market.
More salary data for Vallejo, CA:
Frequently Asked Questions
How much do physical therapists make in Vallejo, CA in 2026?
Is Vallejo, CA a good place to work as a physical therapist?
Can physical therapists make $100K in Vallejo?
What is the cost-of-living adjusted physical therapist salary in Vallejo?
How much does a physical therapist make per hour in Vallejo?
Related Pages
Compare Salaries
Career Resources
Nearby Cities in California
Written by Alex Morgan, DPT
Career Analyst
Alex Morgan has over 10 years of experience in physical therapy. They specialize in orthopedic rehabilitation. Alex works in a private practice setting.
Methodology & Data Source
Salary figures on this page are 2026 projections based on the Bureau of Labor Statistics Occupational Employment and Wage Statistics (OEWS) survey, May 2026 release. The BLS reported a median annual salary of $141,530 for physical therapistsin the Vallejo metropolitan area. A 2.46% compound annual growth rate (CAGR), calculated from 6-year national BLS wage trends, was applied to project current 2026 compensation. Percentile ranges (P10–P90) represent the full salary distribution across experience levels and practice settings in this market.
Data Sources & Methodology
Source: BLS, OEWS, 7-year dataset (–). Per-city data from annual BLS metropolitan area surveys.
2026 figures are projected from 2025 BLS data using a compound annual growth rate (CAGR) of 2.46%, derived from historical BLS wage trends for physical therapists (SOC 29-1123).
Compiled and verified by Alex Morgan, DPT, a licensed physical therapist with 10+ years of clinical experience. · View source data at BLS.gov