Physical Therapist Salary in Brighton, CO: $97,831 (2026)
Quick Answer:A full-time physical therapist in Brighton, CO earns a median $97,831/year (≈ $47.03/hour) in nominal terms for 2026 — projected from BLS OEWS 2025 (SOC 29-1123). Once you factor in Brighton's price level (5% above national, BEA RPP 105.0), that paycheck buys what $93,172 would nationally. Nominal pay sits 4.7% below the Colorado state average.
Based on BLS state-level estimates · View source
In 2026, the physical therapist salary in Brighton, CO, is projected to reach a median annual income of $97,831. This figure represents a notable contrast to the national median of $105,288, indicating that local pay is slightly below the national average. Salary estimates for physical therapists in this region range from $77,318 at the 10th percentile to as high as $127,508 for the 90th percentile. These projections are based on 2025 BLS data, adjusted for regional cost considerations, which reflect the increasing trend of cash-pay models in sports and orthopedic facilities. This shift often elevates top earnings in outpatient settings, making Brighton an appealing option for those entering the field.
About the Brighton Market
Salary estimated from Colorado average ($93,000) adjusted for local cost of living.
Salary Breakdown
| Percentile | Annual | Hourly |
|---|---|---|
| Entry Level (P10) | $77,318 | $37.17 |
| Lower Range (P25) | $83,729 | $40.26 |
| Median (P50)(typical) | $97,831 | $47.03 |
| Upper Range (P75) | $115,681 | $55.62 |
| Top Earners (P90) | $127,508 | $61.30 |
Median Salary Position
7.08% below the national average
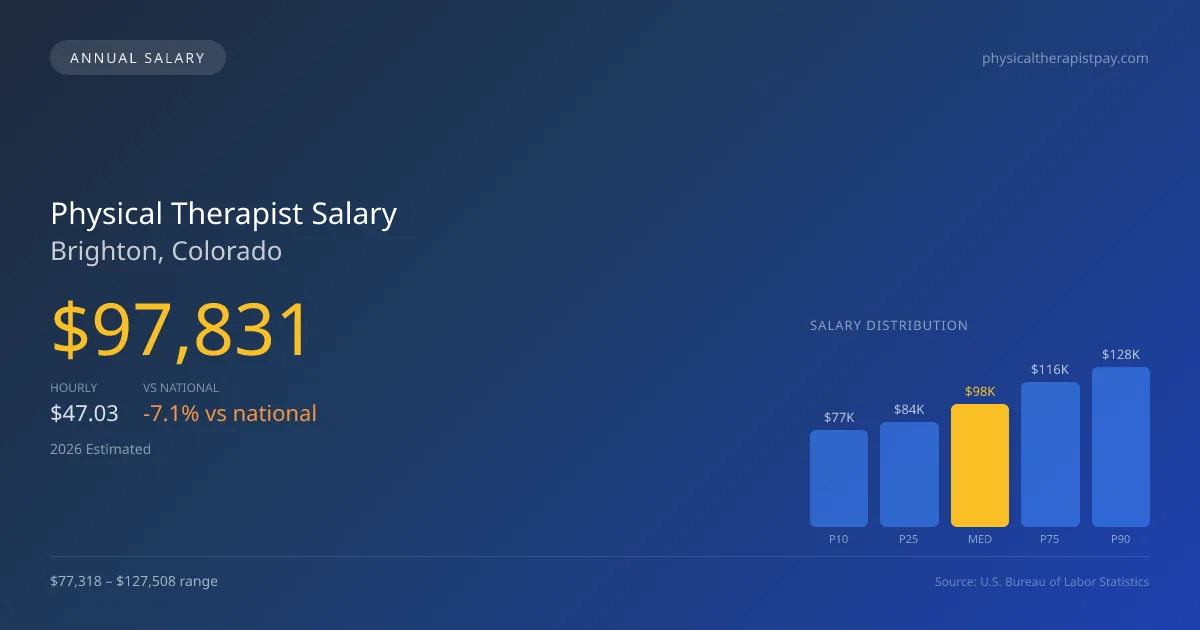
2026 Salary Percentile Distribution in Brighton
In Brighton, CO, the physical therapist salary spread from the 10th to 90th percentile is $50,190 (2026 est.). At $97,831, the local median is 7.08% below the national median of $105,288.
Salary Calculator
At 40 hours/week in Brighton: You'd be in the lower-middle range
How Brighton Physical Therapist Pay Compares
Brighton median: $97,831/year (2026)
| Compared To | Median Salary | Brighton Pays |
|---|---|---|
| Colorado Average | $102,656 | -4.70% less |
| National Average | $105,288 | -7.08% less |
Physical Therapists in Brighton, CO earn a median of $97,831 per year (2026 est.), which is 7.08% lower than the national median of $105,288 and 4.70% below the Colorado state average of $102,656.
Cost-of-Living Adjusted Salary
Brighton has a cost of living 5.00% above the national average.
Adjusted salary = nominal × (100 / CoL index). CoL index: 100 = national average.
Brighton, CO has a cost-of-living index of 105 (above the national average of 100). While the nominal salary of $97,831 is competitive, the higher cost of living reduces purchasing power to an effective $93,172 — a 4.76% reduction.
Compare Purchasing Power
Select a city to see how your salary compares after cost of living
Select a city above to compare purchasing power
2019 BLS Actual
$83,105
2025 BLS Actual
$95,482
2026 Current Est.
$97,831
2019–2027 Growth
+20.6%
Salary Trajectory for Physical Therapists in Brighton (2019–2027)
2019–2025: actual BLS OEWS data for this metro area. 2026+: CAGR 2.46% projection.
| Year | Annual Salary | Status |
|---|---|---|
| 2019 | $83,105 | Actual |
| 2020 | $84,564 | Actual |
| 2021 | $88,848 | Actual |
| 2022 | $90,799 | Actual |
| 2023 | $92,648 | Actual |
| 2024 | $93,080 | Actual |
| 2025 | $95,482 | Actual |
| 2026(current) | $97,831 | Estimated |
| 2027 | $100,237 | Projected |
Based on 7 years of BLS OEWS data for the Brighton metropolitan area, the median physical therapist salary grew 14.9% from $83,105 (2019) to $95,482 (2025). At a 2.46% compound annual growth rate, salaries are projected to reach $100,237 by 2027 — a total increase of $17,132 (20.61%) from 2019.
Note: Historical values (2019–2025) are actual BLS OEWS figures for the Brighton metropolitan area, sourced from annual Occupational Employment and Wage Statistics surveys. 2026–2026 figures are current estimates, and 2027 values are projections, calculated using a 2.46% CAGR derived from 7-year BLS historical data. Actual salaries may vary based on employer, experience, certifications, and local market conditions.
Salary by Experience Level
| Experience | Estimated Salary Range |
|---|---|
| 0-2 years (New Graduate) | $77,318 – $83,729 |
| 3-5 years (Mid Career) | $83,729 – $97,831 |
| 5+ years (Experienced) | $97,831 – $115,681 |
| 10+ years (Top Earner) | $115,681 – $127,508 |
PT salary ranges estimated from BLS percentile data. Individual physical therapist compensation varies by employer, certifications, and specialization.
Physical Therapist Job Market in Brighton
Currently, there are just seven physical therapists employed in Brighton, highlighting a potentially strong local job market amidst growing demand. The cost-of-living index for the area sits slightly above the national average at 105, meaning that while salaries may be lower than the national figures, purchasing power remains a vital consideration for residents. Among local employers, outpatient orthopedic clinics, particularly chains like ATI and Athletico, generally offer competitive pay, though hospital systems can sometimes provide more lucrative opportunities due to broader funding. Variability in pay also arises from factors such as board certification stipends, clinic ownership equity, and the practice model adopted—whether cash-based or insurance-driven. To maximize earnings in Brighton, physical therapists should consider pursuing board specialization (OCS/SCS), engaging in high-volume productivity environments, or even exploring travel PT roles that often come with higher pay rates.
More salary data for Brighton, CO:
Frequently Asked Questions
How much do physical therapists make in Brighton, CO in 2026?
Is Brighton, CO a good place to work as a physical therapist?
Can physical therapists make $100K in Brighton?
What is the cost-of-living adjusted physical therapist salary in Brighton?
How much does a physical therapist make per hour in Brighton?
Related Pages
Compare Salaries
Career Resources
Nearby Cities in Colorado
Written by Alex Morgan, DPT
Career Analyst
Alex Morgan has over 10 years of experience in physical therapy. They specialize in orthopedic rehabilitation. Alex works in a private practice setting.
Methodology & Data Source
Salary figures on this page are 2026 projections based on the Bureau of Labor Statistics Occupational Employment and Wage Statistics (OEWS) survey, May 2026 release. The BLS reported a median annual salary of $95,482 for physical therapistsin the Brighton metropolitan area. A 2.46% compound annual growth rate (CAGR), calculated from 6-year national BLS wage trends, was applied to project current 2026 compensation. Percentile ranges (P10–P90) represent the full salary distribution across experience levels and practice settings in this market.
Data Sources & Methodology
Salary data for Brighton is estimated from official BLS state-level occupational wage data (2025), adjusted for regional cost-of-living differences using BEA RPP (Regional Price Parities).
2026 figures are projected from 2025 BLS data using a compound annual growth rate (CAGR) of 2.46%, derived from historical BLS wage trends for physical therapists (SOC 29-1123).
Compiled and verified by Alex Morgan, DPT, a licensed physical therapist with 10+ years of clinical experience. · View source data at BLS.gov