Physical Therapist Salary in Cape Coral, FL: $104,376 (2026)
Quick Answer:A full-time physical therapist in Cape Coral, FL earns a median $104,376/year (≈ $50.18/hour) in nominal terms for 2026 — projected from BLS OEWS 2025 (SOC 29-1123). Once you factor in Cape Coral's price level (2% above national, BEA RPP 102.3), that paycheck buys what $101,980 would nationally. Nominal pay sits 1.8% above the Florida state average.
Official BLS data · View source
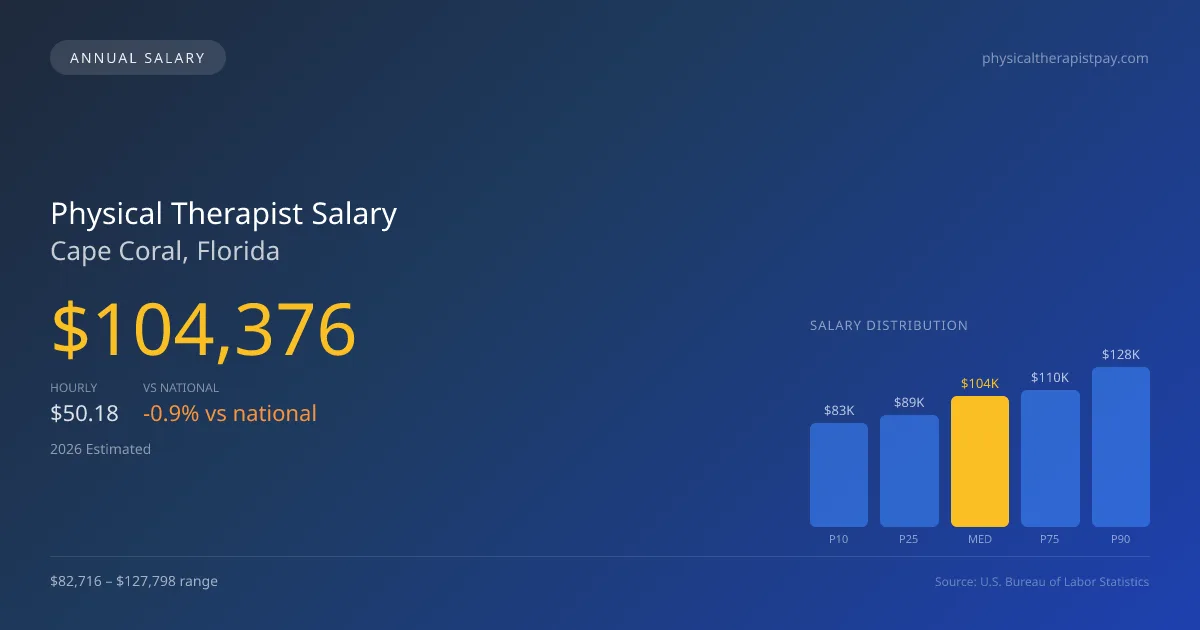
In Cape Coral, the projected median annual salary for physical therapists in 2026 is $104,376, slightly below the national average of $105,288. The salary range varies widely from $82,716 at the 10th percentile to $127,798 at the 90th percentile, reflecting the diverse settings in which these professionals can work. Outpatient orthopedic clinics, often preferred for their flexible hours and relatively high patient volume, typically offer lower base pay compared to hospital systems, which may provide lucrative productivity bonuses. These differences underscore the importance of understanding the local market dynamics as physical therapists navigate their career options in Cape Coral, Florida.
Salary Breakdown
| Percentile | Annual | Hourly |
|---|---|---|
| Entry Level (P10) | $82,716 | $39.76 |
| Lower Range (P25) | $89,478 | $43.01 |
| Median (P50)(typical) | $104,376 | $50.18 |
| Upper Range (P75) | $109,765 | $52.78 |
| Top Earners (P90) | $127,798 | $61.44 |
Median Salary Position
0.87% below the national average
2026 Salary Percentile Distribution in Cape Coral
In Cape Coral, FL, the physical therapist salary spread from the 10th to 90th percentile is $45,082 (2026 est.). At $104,376, the local median is 0.87% below the national median of $105,288.
Salary Calculator
At 40 hours/week in Cape Coral: You'd be in the lower-middle range
How Cape Coral Physical Therapist Pay Compares
Cape Coral median: $104,376/year (2026)
| Compared To | Median Salary | Cape Coral Pays |
|---|---|---|
| Florida Average | $102,530 | +1.80% more |
| National Average | $105,288 | -0.87% less |
Physical Therapists in Cape Coral, FL earn a median of $104,376 per year (2026 est.), which is 0.87% lower than the national median of $105,288 and 1.80% above the Florida state average of $102,530.
Cost-of-Living Adjusted Salary
Cape Coral has a cost of living 2.35% above the national average.
Adjusted salary = nominal × (100 / CoL index). CoL index: 100 = national average.
Cape Coral, FL has a cost-of-living index of 102.349 (above the national average of 100). While the nominal salary of $104,376 is competitive, the higher cost of living reduces purchasing power to an effective $101,980 — a 2.3% reduction.
Compare Purchasing Power
Select a city to see how your salary compares after cost of living
Select a city above to compare purchasing power
2019 BLS Actual
$88,130
2025 BLS Actual
$101,870
2026 Current Est.
$104,376
2019–2027 Growth
+21.3%
Salary Trajectory for Physical Therapists in Cape Coral (2019–2027)
2019–2025: actual BLS OEWS data for this metro area. 2026+: CAGR 2.46% projection.
| Year | Annual Salary | Status |
|---|---|---|
| 2019 | $88,130 | Actual |
| 2020 | $89,340 | Actual |
| 2021 | $96,120 | Actual |
| 2022 | $90,720 | Actual |
| 2023 | $95,450 | Actual |
| 2024 | $98,240 | Actual |
| 2025 | $101,870 | Actual |
| 2026(current) | $104,376 | Estimated |
| 2027 | $106,944 | Projected |
Based on 7 years of BLS OEWS data for the Cape Coral metropolitan area, the median physical therapist salary grew 15.6% from $88,130 (2019) to $101,870 (2025). At a 2.46% compound annual growth rate, salaries are projected to reach $106,944 by 2027 — a total increase of $18,814 (21.35%) from 2019.
Note: Historical values (2019–2025) are actual BLS OEWS figures for the Cape Coral metropolitan area, sourced from annual Occupational Employment and Wage Statistics surveys. 2026–2026 figures are current estimates, and 2027 values are projections, calculated using a 2.46% CAGR derived from 7-year BLS historical data. Actual salaries may vary based on employer, experience, certifications, and local market conditions.
Salary by Experience Level
| Experience | Estimated Salary Range |
|---|---|
| 0-2 years (New Graduate) | $82,716 – $89,478 |
| 3-5 years (Mid Career) | $89,478 – $104,376 |
| 5+ years (Experienced) | $104,376 – $109,765 |
| 10+ years (Top Earner) | $109,765 – $127,798 |
PT salary ranges estimated from BLS percentile data. Individual physical therapist compensation varies by employer, certifications, and specialization.
Physical Therapist Job Market in Cape Coral
As of 2026, there are around 630 physical therapists employed in Cape Coral, contributing to a competitive job market. With a cost of living index at 102.349, therapists may find that their purchasing power is impacted, as this figure is slightly above the national average. Employers in the area, including large outpatient chains and specialized clinics, drive variations in pay largely due to a range of factors such as board certification incentives, patient volume requirements, and the practice model adopted—whether cash-pay or insurance-based. Therapists looking to maximize their earnings should consider pursuing board certifications like the OCS or SCS, which can provide additional stipend opportunities, and aligning their practice goals with high-demand areas such as sports medicine or pediatric care. Given the upward growth trend in employment, staying adept in productivity-focused environments will be key to success.
More salary data for Cape Coral, FL:
Frequently Asked Questions
How much do physical therapists make in Cape Coral, FL in 2026?
Is Cape Coral, FL a good place to work as a physical therapist?
Can physical therapists make $100K in Cape Coral?
What is the cost-of-living adjusted physical therapist salary in Cape Coral?
How much does a physical therapist make per hour in Cape Coral?
Related Pages
Compare Salaries
Career Resources
Nearby Cities in Florida
Written by Alex Morgan, DPT
Career Analyst
Alex Morgan has over 10 years of experience in physical therapy. They specialize in orthopedic rehabilitation. Alex works in a private practice setting.
Methodology & Data Source
Salary figures on this page are 2026 projections based on the Bureau of Labor Statistics Occupational Employment and Wage Statistics (OEWS) survey, May 2026 release. The BLS reported a median annual salary of $101,870 for physical therapistsin the Cape Coral metropolitan area. A 2.46% compound annual growth rate (CAGR), calculated from 6-year national BLS wage trends, was applied to project current 2026 compensation. Percentile ranges (P10–P90) represent the full salary distribution across experience levels and practice settings in this market.
Data Sources & Methodology
Source: BLS, OEWS, 7-year dataset (–). Per-city data from annual BLS metropolitan area surveys.
2026 figures are projected from 2025 BLS data using a compound annual growth rate (CAGR) of 2.46%, derived from historical BLS wage trends for physical therapists (SOC 29-1123).
Compiled and verified by Alex Morgan, DPT, a licensed physical therapist with 10+ years of clinical experience. · View source data at BLS.gov