Physical Therapist Salary in Pensacola, FL: $100,759 (2026)
Quick Answer:A full-time physical therapist in Pensacola, FL earns a median $100,759/year (≈ $48.44/hour) in nominal terms for 2026 — projected from BLS OEWS 2025 (SOC 29-1123). Once you factor in Pensacola's price level (2% below national, BEA RPP 97.7), that paycheck buys what $103,113 would nationally. Nominal pay sits 1.8% below the Florida state average.
Official BLS data · View source
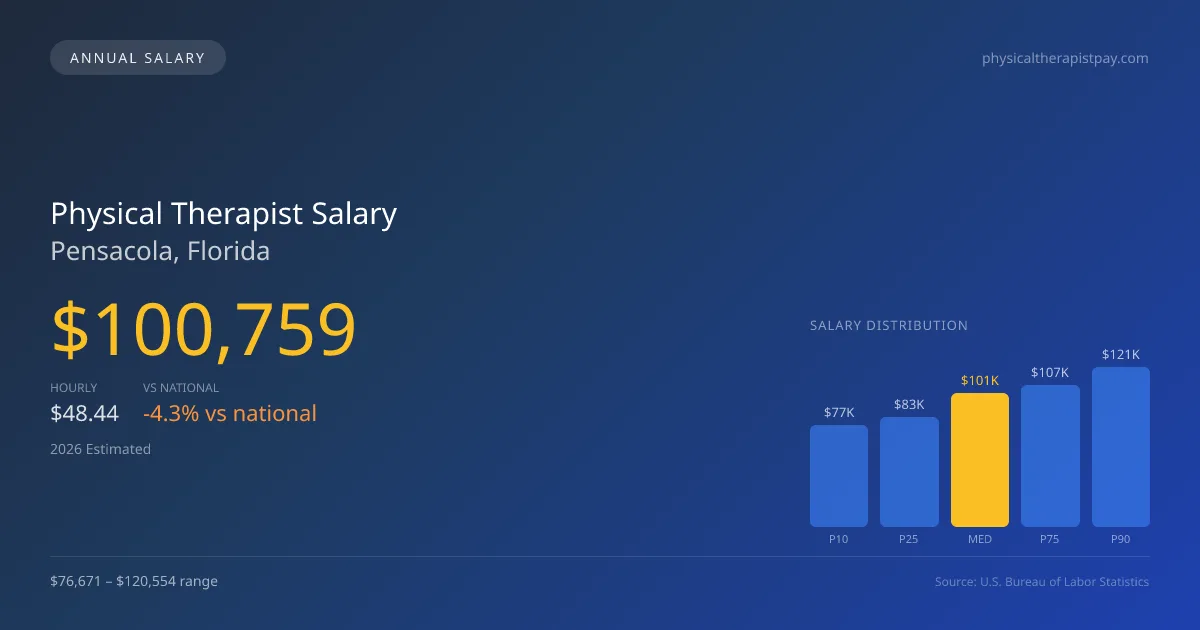
In 2026, the physical therapist salary in Pensacola, FL, is projected to reach a median of $100,759 annually, reflecting a competitive compensation landscape within the field. The salary range varies considerably, from $76,671 at the 10th percentile to $120,554 at the 90th percentile, indicating that top-end salaries can be significantly higher for those specializing in cash-pay orthopedic practices. This data, derived from the official Bureau of Labor Statistics (BLS) OEWS surveys, reflects an evolving market where outpatient orthopedic specialists often command higher wages, particularly in a city like Pensacola that is seeing robust growth in health services. The job market for physical therapists remains strong, with around 400 professionals employed in the area, highlighting a healthy demand for rehabilitation services.
Salary Breakdown
| Percentile | Annual | Hourly |
|---|---|---|
| Entry Level (P10) | $76,671 | $36.85 |
| Lower Range (P25) | $83,177 | $39.99 |
| Median (P50)(typical) | $100,759 | $48.44 |
| Upper Range (P75) | $106,620 | $51.26 |
| Top Earners (P90) | $120,554 | $57.96 |
Median Salary Position
4.3% below the national average
2026 Salary Percentile Distribution in Pensacola
In Pensacola, FL, the physical therapist salary spread from the 10th to 90th percentile is $43,883 (2026 est.). At $100,759, the local median is 4.3% below the national median of $105,288.
Salary Calculator
At 40 hours/week in Pensacola: You'd be above the median
How Pensacola Physical Therapist Pay Compares
Pensacola median: $100,759/year (2026)
| Compared To | Median Salary | Pensacola Pays |
|---|---|---|
| Florida Average | $102,606 | -1.80% less |
| National Average | $105,288 | -4.30% less |
Physical Therapists in Pensacola, FL earn a median of $100,759 per year (2026 est.), which is 4.30% lower than the national median of $105,288 and 1.80% below the Florida state average of $102,606.
Cost-of-Living Adjusted Salary
Pensacola has a cost of living 2.28% below the national average, meaning your salary goes further here.
Adjusted salary = nominal × (100 / CoL index). CoL index: 100 = national average.
Pensacola, FL has a cost-of-living index of 97.717 (below the national average of 100). A physical therapist earning $100,759 nominally has purchasing power equivalent to $103,113 in an average-cost city — an effective 2.34% boost.
Compare Purchasing Power
Select a city to see how your salary compares after cost of living
Select a city above to compare purchasing power
2019 BLS Actual
$83,470
2025 BLS Actual
$98,340
2026 Current Est.
$100,759
2019–2027 Growth
+23.7%
Salary Trajectory for Physical Therapists in Pensacola (2019–2027)
2019–2025: actual BLS OEWS data for this metro area. 2026+: CAGR 2.46% projection.
| Year | Annual Salary | Status |
|---|---|---|
| 2019 | $83,470 | Actual |
| 2020 | $88,420 | Actual |
| 2021 | $80,710 | Actual |
| 2022 | $92,440 | Actual |
| 2023 | $95,010 | Actual |
| 2024 | $96,720 | Actual |
| 2025 | $98,340 | Actual |
| 2026(current) | $100,759 | Estimated |
| 2027 | $103,238 | Projected |
Based on 7 years of BLS OEWS data for the Pensacola metropolitan area, the median physical therapist salary grew 17.8% from $83,470 (2019) to $98,340 (2025). At a 2.46% compound annual growth rate, salaries are projected to reach $103,238 by 2027 — a total increase of $19,768 (23.68%) from 2019.
Note: Historical values (2019–2025) are actual BLS OEWS figures for the Pensacola metropolitan area, sourced from annual Occupational Employment and Wage Statistics surveys. 2026–2026 figures are current estimates, and 2027 values are projections, calculated using a 2.46% CAGR derived from 7-year BLS historical data. Actual salaries may vary based on employer, experience, certifications, and local market conditions.
Salary by Experience Level
| Experience | Estimated Salary Range |
|---|---|
| 0-2 years (New Graduate) | $76,671 – $83,177 |
| 3-5 years (Mid Career) | $83,177 – $100,759 |
| 5+ years (Experienced) | $100,759 – $106,620 |
| 10+ years (Top Earner) | $106,620 – $120,554 |
PT salary ranges estimated from BLS percentile data. Individual physical therapist compensation varies by employer, certifications, and specialization.
Physical Therapist Job Market in Pensacola
Examining the local market dynamics offers further insights into the physical therapist pay in Pensacola, FL. With a cost-of-living index of 97.717, wages may stretch further than in many other regions, providing a favorable environment for take-home purchasing power. Among employers, outpatient orthopedic clinics may offer the highest salaries, particularly for therapists who can drive productivity through cash-pay models, which are becoming increasingly popular. The pay disparity often arises from factors such as clinical productivity expectations, board certification bonus incentives for OCS or SCS accolades, and potential equity in private practices. Physical therapists hoping to maximize their earnings in this market should focus on improving productivity metrics, seeking board certifications, and considering opportunities within cash-pay models, which can yield significant financial rewards despite a national alignment that leans slightly lower in annual compensation benchmarks.
More salary data for Pensacola, FL:
Frequently Asked Questions
How much do physical therapists make in Pensacola, FL in 2026?
Is Pensacola, FL a good place to work as a physical therapist?
Can physical therapists make $100K in Pensacola?
What is the cost-of-living adjusted physical therapist salary in Pensacola?
How much does a physical therapist make per hour in Pensacola?
Related Pages
Compare Salaries
Career Resources
Nearby Cities in Florida
Written by Alex Morgan, DPT
Career Analyst
Alex Morgan has over 10 years of experience in physical therapy. They specialize in orthopedic rehabilitation. Alex works in a private practice setting.
Methodology & Data Source
Salary figures on this page are 2026 projections based on the Bureau of Labor Statistics Occupational Employment and Wage Statistics (OEWS) survey, May 2026 release. The BLS reported a median annual salary of $98,340 for physical therapistsin the Pensacola metropolitan area. A 2.46% compound annual growth rate (CAGR), calculated from 6-year national BLS wage trends, was applied to project current 2026 compensation. Percentile ranges (P10–P90) represent the full salary distribution across experience levels and practice settings in this market.
Data Sources & Methodology
Source: BLS, OEWS, 7-year dataset (–). Per-city data from annual BLS metropolitan area surveys.
2026 figures are projected from 2025 BLS data using a compound annual growth rate (CAGR) of 2.46%, derived from historical BLS wage trends for physical therapists (SOC 29-1123).
Compiled and verified by Alex Morgan, DPT, a licensed physical therapist with 10+ years of clinical experience. · View source data at BLS.gov