Physical Therapist Salary in Sanford, FL: $106,079 (2026)
Quick Answer:A full-time physical therapist in Sanford, FL earns a median $106,079/year (≈ $51.00/hour) in nominal terms for 2026 — projected from BLS OEWS 2025 (SOC 29-1123). Once you factor in Sanford's price level (1% above national, BEA RPP 100.8), that paycheck buys what $105,237 would nationally. Nominal pay sits 3.4% above the Florida state average.
Based on BLS state-level estimates · View source
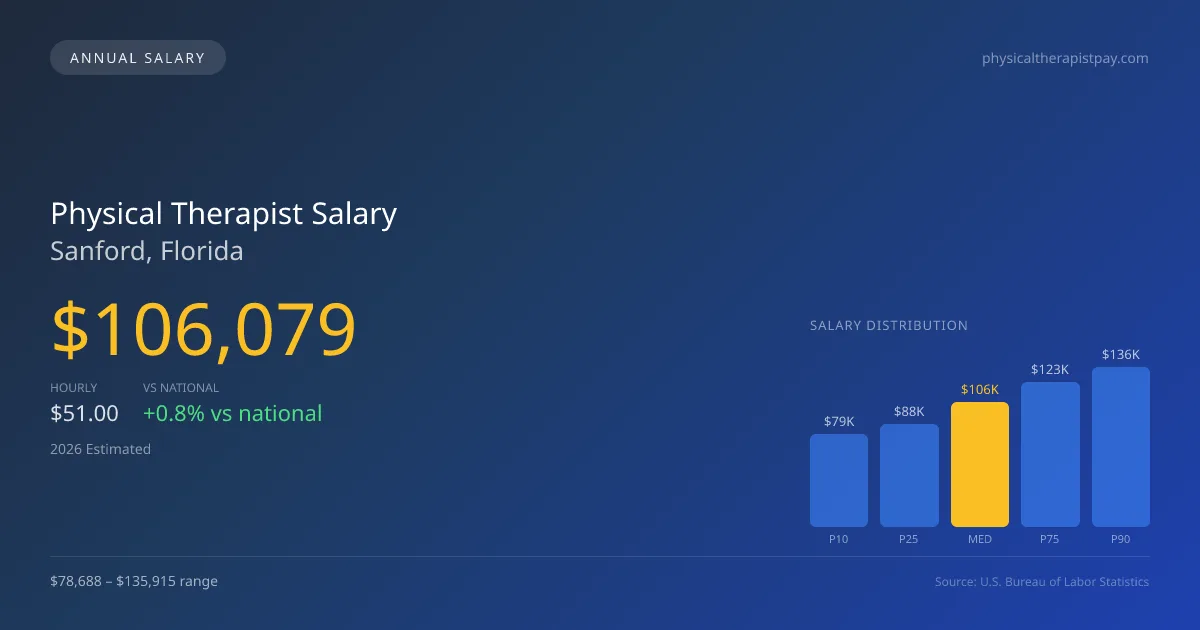
In 2026, physical therapists in Sanford, Florida, can expect a median annual salary of $106,079, which positions them slightly above the national average of $105,288 for this profession. The salary range spans from $78,688 at the 10th percentile to as high as $135,915 at the 90th percentile, reflecting the varying productivity expectations in the local market. These estimates are derived from 2025 BLS state-level data adjusted for regional price variations. As outpatient clinics and healthcare providers continue to adapt to a high-demand environment, the financial opportunities for physical therapists are evolving, influenced by factors like patient volume and reimbursement models.
About the Sanford Market
Salary estimated from Florida average ($93,000) adjusted for local cost of living.
Salary Breakdown
| Percentile | Annual | Hourly |
|---|---|---|
| Entry Level (P10) | $78,688 | $37.83 |
| Lower Range (P25) | $87,766 | $42.19 |
| Median (P50)(typical) | $106,079 | $51.00 |
| Upper Range (P75) | $123,387 | $59.32 |
| Top Earners (P90) | $135,915 | $65.35 |
Median Salary Position
0.75% above the national average
2026 Salary Percentile Distribution in Sanford
In Sanford, FL, the physical therapist salary spread from the 10th to 90th percentile is $57,227 (2026 est.). At $106,079, the local median is 0.75% above the national median of $105,288.
Salary Calculator
At 40 hours/week in Sanford: You'd be in the lower-middle range
How Sanford Physical Therapist Pay Compares
Sanford median: $106,079/year (2026)
| Compared To | Median Salary | Sanford Pays |
|---|---|---|
| Florida Average | $102,591 | +3.40% more |
| National Average | $105,288 | +0.75% more |
Physical Therapists in Sanford, FL earn a median of $106,079 per year (2026 est.), which is 0.75% higher than the national median of $105,288 and 3.40% above the Florida state average of $102,591.
Cost-of-Living Adjusted Salary
Sanford has a cost of living 0.80% above the national average.
Adjusted salary = nominal × (100 / CoL index). CoL index: 100 = national average.
Sanford, FL has a cost-of-living index of 100.8 (above the national average of 100). While the nominal salary of $106,079 is competitive, the higher cost of living reduces purchasing power to an effective $105,237 — a 0.79% reduction.
Compare Purchasing Power
Select a city to see how your salary compares after cost of living
Select a city above to compare purchasing power
2019 BLS Actual
$90,112
2025 BLS Actual
$103,532
2026 Current Est.
$106,079
2019–2027 Growth
+20.6%
Salary Trajectory for Physical Therapists in Sanford (2019–2027)
2019–2025: actual BLS OEWS data for this metro area. 2026+: CAGR 2.46% projection.
| Year | Annual Salary | Status |
|---|---|---|
| 2019 | $90,112 | Actual |
| 2020 | $91,694 | Actual |
| 2021 | $96,338 | Actual |
| 2022 | $98,454 | Actual |
| 2023 | $100,459 | Actual |
| 2024 | $94,637 | Actual |
| 2025 | $103,532 | Actual |
| 2026(current) | $106,079 | Estimated |
| 2027 | $108,688 | Projected |
Based on 7 years of BLS OEWS data for the Sanford metropolitan area, the median physical therapist salary grew 14.9% from $90,112 (2019) to $103,532 (2025). At a 2.46% compound annual growth rate, salaries are projected to reach $108,688 by 2027 — a total increase of $18,576 (20.61%) from 2019.
Note: Historical values (2019–2025) are actual BLS OEWS figures for the Sanford metropolitan area, sourced from annual Occupational Employment and Wage Statistics surveys. 2026–2026 figures are current estimates, and 2027 values are projections, calculated using a 2.46% CAGR derived from 7-year BLS historical data. Actual salaries may vary based on employer, experience, certifications, and local market conditions.
Salary by Experience Level
| Experience | Estimated Salary Range |
|---|---|
| 0-2 years (New Graduate) | $78,688 – $87,766 |
| 3-5 years (Mid Career) | $87,766 – $106,079 |
| 5+ years (Experienced) | $106,079 – $123,387 |
| 10+ years (Top Earner) | $123,387 – $135,915 |
PT salary ranges estimated from BLS percentile data. Individual physical therapist compensation varies by employer, certifications, and specialization.
Physical Therapist Job Market in Sanford
With only 16 physical therapists currently employed in Sanford, the local job market is relatively small, leading to a competitive environment that can impact salary negotiations. The cost-of-living index in the area is slightly above the national average at 100.8, suggesting that while salaries are attractive, take-home pay may be tempered by local prices. Employers in Sanford, including outpatient orthopedic clinics like Athletico, often provide competitive pay structures that reward productivity, which can escalate earnings through performance-based incentives. High salaries typically align with board-certified specialists who bring added value to their roles. To maximize physical therapist pay in Sanford, pursuing advanced board certifications such as OCS or SCS, understanding local market demands, and considering roles in high-performing practices or cash-pay settings can be advantageous strategies. Adjusting to changing reimbursement landscapes also allows therapists to optimize their earning potential within this dynamic field.
More salary data for Sanford, FL:
Frequently Asked Questions
How much do physical therapists make in Sanford, FL in 2026?
Is Sanford, FL a good place to work as a physical therapist?
Can physical therapists make $100K in Sanford?
What is the cost-of-living adjusted physical therapist salary in Sanford?
How much does a physical therapist make per hour in Sanford?
Related Pages
Compare Salaries
Career Resources
Nearby Cities in Florida
Written by Alex Morgan, DPT
Career Analyst
Alex Morgan has over 10 years of experience in physical therapy. They specialize in orthopedic rehabilitation. Alex works in a private practice setting.
Methodology & Data Source
Salary figures on this page are 2026 projections based on the Bureau of Labor Statistics Occupational Employment and Wage Statistics (OEWS) survey, May 2026 release. The BLS reported a median annual salary of $103,532 for physical therapistsin the Sanford metropolitan area. A 2.46% compound annual growth rate (CAGR), calculated from 6-year national BLS wage trends, was applied to project current 2026 compensation. Percentile ranges (P10–P90) represent the full salary distribution across experience levels and practice settings in this market.
Data Sources & Methodology
Salary data for Sanford is estimated from official BLS state-level occupational wage data (2025), adjusted for regional cost-of-living differences using BEA RPP (Regional Price Parities).
2026 figures are projected from 2025 BLS data using a compound annual growth rate (CAGR) of 2.46%, derived from historical BLS wage trends for physical therapists (SOC 29-1123).
Compiled and verified by Alex Morgan, DPT, a licensed physical therapist with 10+ years of clinical experience. · View source data at BLS.gov