Physical Therapist Salary in Anderson, IN: $98,582 (2026)
Quick Answer:A full-time physical therapist in Anderson, IN earns a median $98,582/year (≈ $47.40/hour) in nominal terms for 2026 — projected from BLS OEWS 2025 (SOC 29-1123). Once you factor in Anderson's price level (9% below national, BEA RPP 91.3), that paycheck buys what $107,976 would nationally. Nominal pay sits 2.3% below the Indiana state average.
Based on BLS state-level estimates · View source
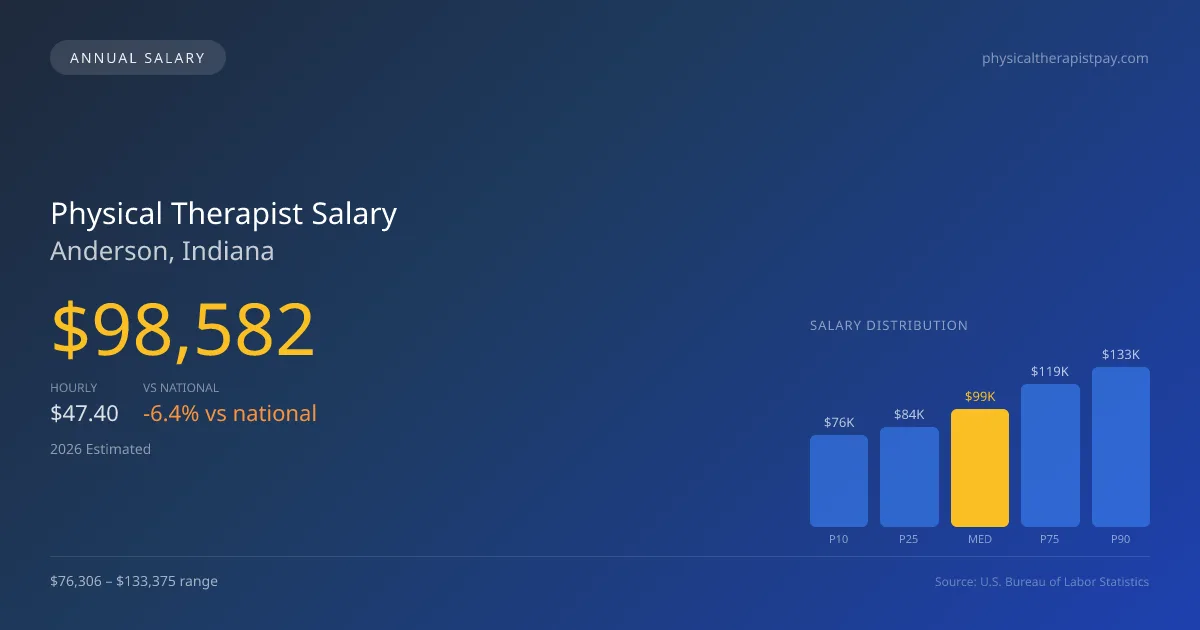
In 2026, physical therapist salaries in Anderson, Indiana are projected to be competitive, with a median annual salary of $98,582. This figure falls below the national median of $105,288, which reflects the localized economic factors impacting compensation in this area. Salaries are expected to range from $76,306 at the 10th percentile to $133,375 at the 90th percentile, indicating that while there are opportunities for higher earnings, entry-level positions may offer less attractive pay rates. Local estimates derive from 2025 BLS data, adjusted for regional cost variations, highlighting how visit-per-day expectations shape effective hourly compensation. With a robust healthcare demand, the job market for physical therapists in Anderson holds promise for both new graduates and experienced practitioners seeking to optimize their compensation.
About the Anderson Market
Salary estimated from Indiana average ($92,000) adjusted for local cost of living.
Salary Breakdown
| Percentile | Annual | Hourly |
|---|---|---|
| Entry Level (P10) | $76,306 | $36.68 |
| Lower Range (P25) | $83,646 | $40.22 |
| Median (P50)(typical) | $98,582 | $47.40 |
| Upper Range (P75) | $118,907 | $57.16 |
| Top Earners (P90) | $133,375 | $64.12 |
Median Salary Position
6.37% below the national average
2026 Salary Percentile Distribution in Anderson
In Anderson, IN, the physical therapist salary spread from the 10th to 90th percentile is $57,069 (2026 est.). At $98,582, the local median is 6.37% below the national median of $105,288.
Salary Calculator
At 40 hours/week in Anderson: You'd be in the lower-middle range
How Anderson Physical Therapist Pay Compares
Anderson median: $98,582/year (2026)
| Compared To | Median Salary | Anderson Pays |
|---|---|---|
| Indiana Average | $100,903 | -2.30% less |
| National Average | $105,288 | -6.37% less |
Physical Therapists in Anderson, IN earn a median of $98,582 per year (2026 est.), which is 6.37% lower than the national median of $105,288 and 2.30% below the Indiana state average of $100,903.
Cost-of-Living Adjusted Salary
Anderson has a cost of living 8.70% below the national average, meaning your salary goes further here.
Adjusted salary = nominal × (100 / CoL index). CoL index: 100 = national average.
Anderson, IN has a cost-of-living index of 91.3 (below the national average of 100). A physical therapist earning $98,582 nominally has purchasing power equivalent to $107,976 in an average-cost city — an effective 9.53% boost.
Compare Purchasing Power
Select a city to see how your salary compares after cost of living
Select a city above to compare purchasing power
2019 BLS Actual
$83,743
2025 BLS Actual
$96,215
2026 Current Est.
$98,582
2019–2027 Growth
+20.6%
Salary Trajectory for Physical Therapists in Anderson (2019–2027)
2019–2025: actual BLS OEWS data for this metro area. 2026+: CAGR 2.46% projection.
| Year | Annual Salary | Status |
|---|---|---|
| 2019 | $83,743 | Actual |
| 2020 | $85,213 | Actual |
| 2021 | $89,530 | Actual |
| 2022 | $91,496 | Actual |
| 2023 | $93,359 | Actual |
| 2024 | $82,102 | Actual |
| 2025 | $96,215 | Actual |
| 2026(current) | $98,582 | Estimated |
| 2027 | $101,007 | Projected |
Based on 7 years of BLS OEWS data for the Anderson metropolitan area, the median physical therapist salary grew 14.9% from $83,743 (2019) to $96,215 (2025). At a 2.46% compound annual growth rate, salaries are projected to reach $101,007 by 2027 — a total increase of $17,264 (20.62%) from 2019.
Note: Historical values (2019–2025) are actual BLS OEWS figures for the Anderson metropolitan area, sourced from annual Occupational Employment and Wage Statistics surveys. 2026–2026 figures are current estimates, and 2027 values are projections, calculated using a 2.46% CAGR derived from 7-year BLS historical data. Actual salaries may vary based on employer, experience, certifications, and local market conditions.
Salary by Experience Level
| Experience | Estimated Salary Range |
|---|---|
| 0-2 years (New Graduate) | $76,306 – $83,646 |
| 3-5 years (Mid Career) | $83,646 – $98,582 |
| 5+ years (Experienced) | $98,582 – $118,907 |
| 10+ years (Top Earner) | $118,907 – $133,375 |
PT salary ranges estimated from BLS percentile data. Individual physical therapist compensation varies by employer, certifications, and specialization.
Physical Therapist Job Market in Anderson
While only 11 physical therapists are currently employed in the Anderson area, the potential for growth in this small yet focused job market exists. The cost of living in Anderson is lower than the national average, with a cost-of-living index of 91.3, translating to a more favorable take-home salary compared to many other regions. Outpatient orthopedic clinics, particularly established chains like Athletico and ATI, tend to offer robust pay structures, often linked to productivity bonuses. However, the disparity between lower and higher salaries can reflect productivity expectations, clinic ownership equity, and whether practitioners focus on cash-pay or insurance-based models. To maximize earning potential, physical therapists in Anderson should aim for board certifications such as OCS or SCS and consider specialized settings to enhance their marketability, which can provide significant financial benefits.
More salary data for Anderson, IN:
Frequently Asked Questions
How much do physical therapists make in Anderson, IN in 2026?
Is Anderson, IN a good place to work as a physical therapist?
Can physical therapists make $100K in Anderson?
What is the cost-of-living adjusted physical therapist salary in Anderson?
How much does a physical therapist make per hour in Anderson?
Related Pages
Compare Salaries
Career Resources
Nearby Cities in Indiana
Written by Alex Morgan, DPT
Career Analyst
Alex Morgan has over 10 years of experience in physical therapy. They specialize in orthopedic rehabilitation. Alex works in a private practice setting.
Methodology & Data Source
Salary figures on this page are 2026 projections based on the Bureau of Labor Statistics Occupational Employment and Wage Statistics (OEWS) survey, May 2026 release. The BLS reported a median annual salary of $96,215 for physical therapistsin the Anderson metropolitan area. A 2.46% compound annual growth rate (CAGR), calculated from 6-year national BLS wage trends, was applied to project current 2026 compensation. Percentile ranges (P10–P90) represent the full salary distribution across experience levels and practice settings in this market.
Data Sources & Methodology
Salary data for Anderson is estimated from official BLS state-level occupational wage data (2025), adjusted for regional cost-of-living differences using BEA RPP (Regional Price Parities).
2026 figures are projected from 2025 BLS data using a compound annual growth rate (CAGR) of 2.46%, derived from historical BLS wage trends for physical therapists (SOC 29-1123).
Compiled and verified by Alex Morgan, DPT, a licensed physical therapist with 10+ years of clinical experience. · View source data at BLS.gov