Physical Therapist Salary in Lawrence, IN: $96,489 (2026)
Quick Answer:A full-time physical therapist in Lawrence, IN earns a median $96,489/year (≈ $46.39/hour) in nominal terms for 2026 — projected from BLS OEWS 2025 (SOC 29-1123). Once you factor in Lawrence's price level (9% below national, BEA RPP 91.3), that paycheck buys what $105,683 would nationally. Nominal pay sits 4.3% below the Indiana state average.
Based on BLS state-level estimates · View source
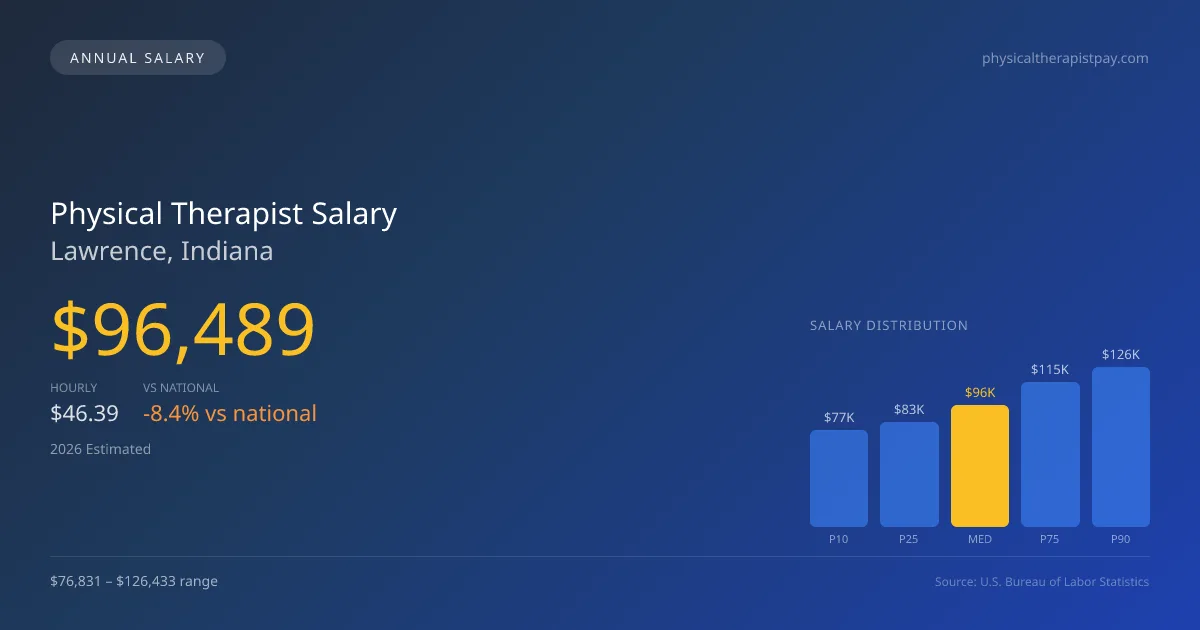
In 2026, the financial landscape for physical therapy professionals in Lawrence, Indiana, positions them with a median annual salary of $96,489. This figure, derived from 2025 BLS data and adjusted for regional price differences, reflects a salary range stretching from $76,831 at the 10th percentile to $126,433 at the 90th percentile. Compared to the national median of $105,288 for that year, this local salary indicates a slight underperformance of approximately 8.36%. Such figures are crucial for physical therapists to navigate their career expectations in Lawrence, especially considering the productivity demands prevalent in the market, which dictate effective compensation through visits-per-day expectations.
About the Lawrence Market
Salary estimated from Indiana average ($92,000) adjusted for local cost of living.
Salary Breakdown
| Percentile | Annual | Hourly |
|---|---|---|
| Entry Level (P10) | $76,831 | $36.94 |
| Lower Range (P25) | $83,004 | $39.91 |
| Median (P50)(typical) | $96,489 | $46.39 |
| Upper Range (P75) | $114,505 | $55.05 |
| Top Earners (P90) | $126,433 | $60.79 |
Median Salary Position
8.36% below the national average
2026 Salary Percentile Distribution in Lawrence
In Lawrence, IN, the physical therapist salary spread from the 10th to 90th percentile is $49,602 (2026 est.). At $96,489, the local median is 8.36% below the national median of $105,288.
Salary Calculator
At 40 hours/week in Lawrence: You'd be in the lower-middle range
How Lawrence Physical Therapist Pay Compares
Lawrence median: $96,489/year (2026)
| Compared To | Median Salary | Lawrence Pays |
|---|---|---|
| Indiana Average | $100,824 | -4.30% less |
| National Average | $105,288 | -8.36% less |
Physical Therapists in Lawrence, IN earn a median of $96,489 per year (2026 est.), which is 8.36% lower than the national median of $105,288 and 4.30% below the Indiana state average of $100,824.
Cost-of-Living Adjusted Salary
Lawrence has a cost of living 8.70% below the national average, meaning your salary goes further here.
Adjusted salary = nominal × (100 / CoL index). CoL index: 100 = national average.
Lawrence, IN has a cost-of-living index of 91.3 (below the national average of 100). A physical therapist earning $96,489 nominally has purchasing power equivalent to $105,683 in an average-cost city — an effective 9.53% boost.
Compare Purchasing Power
Select a city to see how your salary compares after cost of living
Select a city above to compare purchasing power
2019 BLS Actual
$81,965
2025 BLS Actual
$94,172
2026 Current Est.
$96,489
2019–2027 Growth
+20.6%
Salary Trajectory for Physical Therapists in Lawrence (2019–2027)
2019–2025: actual BLS OEWS data for this metro area. 2026+: CAGR 2.46% projection.
| Year | Annual Salary | Status |
|---|---|---|
| 2019 | $81,965 | Actual |
| 2020 | $83,404 | Actual |
| 2021 | $87,629 | Actual |
| 2022 | $89,553 | Actual |
| 2023 | $91,377 | Actual |
| 2024 | $80,358 | Actual |
| 2025 | $94,172 | Actual |
| 2026(current) | $96,489 | Estimated |
| 2027 | $98,862 | Projected |
Based on 7 years of BLS OEWS data for the Lawrence metropolitan area, the median physical therapist salary grew 14.9% from $81,965 (2019) to $94,172 (2025). At a 2.46% compound annual growth rate, salaries are projected to reach $98,862 by 2027 — a total increase of $16,897 (20.61%) from 2019.
Note: Historical values (2019–2025) are actual BLS OEWS figures for the Lawrence metropolitan area, sourced from annual Occupational Employment and Wage Statistics surveys. 2026–2026 figures are current estimates, and 2027 values are projections, calculated using a 2.46% CAGR derived from 7-year BLS historical data. Actual salaries may vary based on employer, experience, certifications, and local market conditions.
Salary by Experience Level
| Experience | Estimated Salary Range |
|---|---|
| 0-2 years (New Graduate) | $76,831 – $83,004 |
| 3-5 years (Mid Career) | $83,004 – $96,489 |
| 5+ years (Experienced) | $96,489 – $114,505 |
| 10+ years (Top Earner) | $114,505 – $126,433 |
PT salary ranges estimated from BLS percentile data. Individual physical therapist compensation varies by employer, certifications, and specialization.
Physical Therapist Job Market in Lawrence
The job market for physical therapists in Lawrence consists of a relatively small cohort of 10 professionals, making it imperative for individuals entering the field to understand the local dynamics. With a cost-of-living index of 91.3, the economic climate suggests that take-home pay holds more purchasing power than in many other metropolitan areas. Outpatient orthopedic clinics, particularly well-known chains like Athletico and ATI, are the primary employers, but hospital systems offer competitive packages that may include bonuses linked to productivity metrics. Factors contributing to wage variances include the type of practice setting, certification stipends for specialties like OCS or SCS, and whether therapists operate under a cash-based model versus insurance. Therefore, maximizing earnings requires not only clinical skill but also savvy navigation of employment options and compensation strategies that consider these specific local factors affecting physical therapist pay in Lawrence, IN.
More salary data for Lawrence, IN:
Frequently Asked Questions
How much do physical therapists make in Lawrence, IN in 2026?
Is Lawrence, IN a good place to work as a physical therapist?
Can physical therapists make $100K in Lawrence?
What is the cost-of-living adjusted physical therapist salary in Lawrence?
How much does a physical therapist make per hour in Lawrence?
Related Pages
Compare Salaries
Career Resources
Nearby Cities in Indiana
Written by Alex Morgan, DPT
Career Analyst
Alex Morgan has over 10 years of experience in physical therapy. They specialize in orthopedic rehabilitation. Alex works in a private practice setting.
Methodology & Data Source
Salary figures on this page are 2026 projections based on the Bureau of Labor Statistics Occupational Employment and Wage Statistics (OEWS) survey, May 2026 release. The BLS reported a median annual salary of $94,172 for physical therapistsin the Lawrence metropolitan area. A 2.46% compound annual growth rate (CAGR), calculated from 6-year national BLS wage trends, was applied to project current 2026 compensation. Percentile ranges (P10–P90) represent the full salary distribution across experience levels and practice settings in this market.
Data Sources & Methodology
Salary data for Lawrence is estimated from official BLS state-level occupational wage data (2025), adjusted for regional cost-of-living differences using BEA RPP (Regional Price Parities).
2026 figures are projected from 2025 BLS data using a compound annual growth rate (CAGR) of 2.46%, derived from historical BLS wage trends for physical therapists (SOC 29-1123).
Compiled and verified by Alex Morgan, DPT, a licensed physical therapist with 10+ years of clinical experience. · View source data at BLS.gov