Physical Therapist Salary in Muncie, IN: $104,212 (2026)
Quick Answer:A full-time physical therapist in Muncie, IN earns a median $104,212/year (≈ $50.10/hour) in nominal terms for 2026 — projected from BLS OEWS 2025 (SOC 29-1123). Once you factor in Muncie's price level (12% below national, BEA RPP 88.1), that paycheck buys what $118,224 would nationally. Nominal pay sits 3.3% above the Indiana state average.
Official BLS data · View source
For physical therapists in Muncie, Indiana, the projected median annual salary of $104,212 in 2026 reflects a competitive market, especially considering it slightly undercuts the national median of $105,288. The salary range is quite broad, with entry-level positions at about $75,288 and experienced therapists earning up to $120,431. These figures derive from 2025 BLS OEWS data, projected to 2026, highlighting the nuanced compensation landscape shaped by various healthcare settings. The local job market is influenced by the prevalence of outpatient clinics compared to hospitals and skilled nursing facilities, affecting pay scales and overall employment opportunities for physical therapists in Muncie.
Salary Breakdown
| Percentile | Annual | Hourly |
|---|---|---|
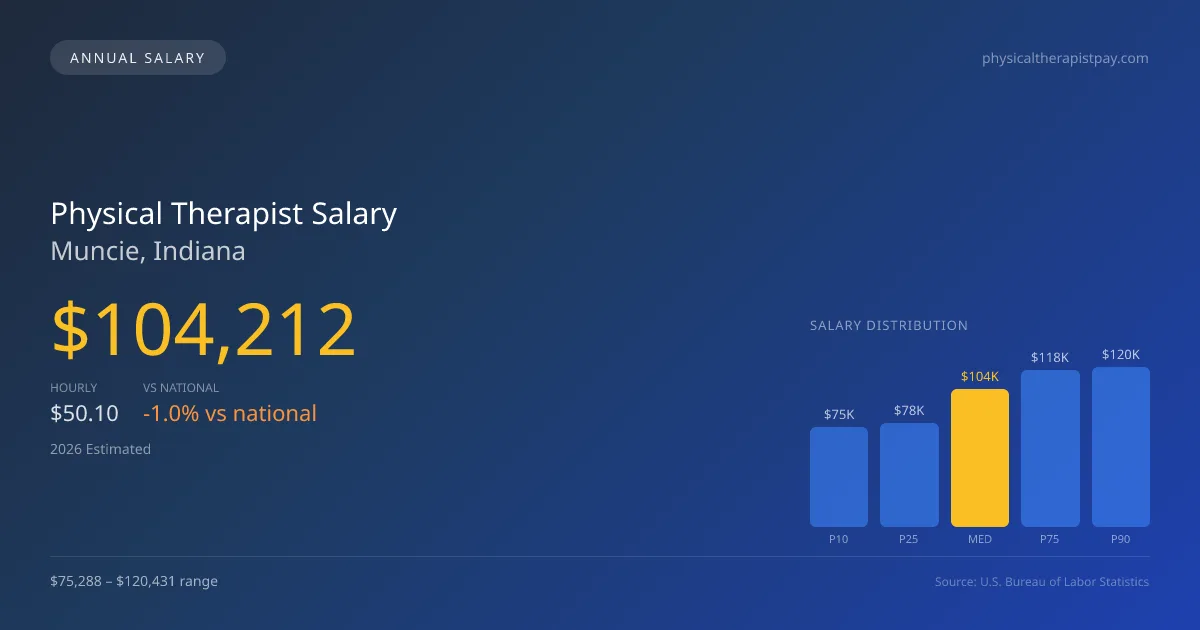
| Entry Level (P10) | $75,288 | $36.20 |
| Lower Range (P25) | $78,003 | $37.50 |
| Median (P50)(typical) | $104,212 | $50.10 |
| Upper Range (P75) | $118,218 | $56.83 |
| Top Earners (P90) | $120,431 | $57.90 |
Median Salary Position
1.02% below the national average
2026 Salary Percentile Distribution in Muncie
In Muncie, IN, the physical therapist salary spread from the 10th to 90th percentile is $45,143 (2026 est.). At $104,212, the local median is 1.02% below the national median of $105,288.
Salary Calculator
At 40 hours/week in Muncie: You'd be above the median
How Muncie Physical Therapist Pay Compares
Muncie median: $104,212/year (2026)
| Compared To | Median Salary | Muncie Pays |
|---|---|---|
| Indiana Average | $100,883 | +3.30% more |
| National Average | $105,288 | -1.02% less |
Physical Therapists in Muncie, IN earn a median of $104,212 per year (2026 est.), which is 1.02% lower than the national median of $105,288 and 3.30% above the Indiana state average of $100,883.
Cost-of-Living Adjusted Salary
Muncie has a cost of living 11.85% below the national average, meaning your salary goes further here.
Adjusted salary = nominal × (100 / CoL index). CoL index: 100 = national average.
Muncie, IN has a cost-of-living index of 88.148 (below the national average of 100). A physical therapist earning $104,212 nominally has purchasing power equivalent to $118,224 in an average-cost city — an effective 13.45% boost.
Compare Purchasing Power
Select a city to see how your salary compares after cost of living
Select a city above to compare purchasing power
2019 BLS Actual
$86,660
2025 BLS Actual
$101,710
2026 Current Est.
$104,212
2019–2027 Growth
+23.2%
Salary Trajectory for Physical Therapists in Muncie (2019–2027)
2019–2025: actual BLS OEWS data for this metro area. 2026+: CAGR 2.46% projection.
| Year | Annual Salary | Status |
|---|---|---|
| 2019 | $86,660 | Actual |
| 2020 | $89,270 | Actual |
| 2021 | $94,643 | Actual |
| 2022 | $92,150 | Actual |
| 2023 | $96,980 | Actual |
| 2024 | $99,420 | Actual |
| 2025 | $101,710 | Actual |
| 2026(current) | $104,212 | Estimated |
| 2027 | $106,776 | Projected |
Based on 7 years of BLS OEWS data for the Muncie metropolitan area, the median physical therapist salary grew 17.4% from $86,660 (2019) to $101,710 (2025). At a 2.46% compound annual growth rate, salaries are projected to reach $106,776 by 2027 — a total increase of $20,116 (23.21%) from 2019.
Note: Historical values (2019–2025) are actual BLS OEWS figures for the Muncie metropolitan area, sourced from annual Occupational Employment and Wage Statistics surveys. 2026–2026 figures are current estimates, and 2027 values are projections, calculated using a 2.46% CAGR derived from 7-year BLS historical data. Actual salaries may vary based on employer, experience, certifications, and local market conditions.
Salary by Experience Level
| Experience | Estimated Salary Range |
|---|---|
| 0-2 years (New Graduate) | $75,288 – $78,003 |
| 3-5 years (Mid Career) | $78,003 – $104,212 |
| 5+ years (Experienced) | $104,212 – $118,218 |
| 10+ years (Top Earner) | $118,218 – $120,431 |
PT salary ranges estimated from BLS percentile data. Individual physical therapist compensation varies by employer, certifications, and specialization.
Physical Therapist Job Market in Muncie
A total of 80 physical therapists are currently employed in Muncie, with the cost of living index sitting at 88.148, indicating a more affordable environment than the national average. This dynamic significantly influences the take-home purchasing power for those in the field. Outpatient orthopedic clinics, particularly chains like ATI and Athletico, may offer lower base pay but potentially higher earnings through productivity bonuses and additional incentives for board certification (such as OCS or SCS). Variations in pay levels stem from differences in practice models, with cash-pay setups often yielding higher immediate compensation compared to insurance-dependent practices. For those looking to maximize their earnings in Muncie, pursuing specialization and enhancing productivity within clinic expectations can be pivotal strategies amidst this evolving healthcare landscape.
More salary data for Muncie, IN:
Frequently Asked Questions
How much do physical therapists make in Muncie, IN in 2026?
Is Muncie, IN a good place to work as a physical therapist?
Can physical therapists make $100K in Muncie?
What is the cost-of-living adjusted physical therapist salary in Muncie?
How much does a physical therapist make per hour in Muncie?
Related Pages
Compare Salaries
Career Resources
Nearby Cities in Indiana
Written by Alex Morgan, DPT
Career Analyst
Alex Morgan has over 10 years of experience in physical therapy. They specialize in orthopedic rehabilitation. Alex works in a private practice setting.
Methodology & Data Source
Salary figures on this page are 2026 projections based on the Bureau of Labor Statistics Occupational Employment and Wage Statistics (OEWS) survey, May 2026 release. The BLS reported a median annual salary of $101,710 for physical therapistsin the Muncie metropolitan area. A 2.46% compound annual growth rate (CAGR), calculated from 6-year national BLS wage trends, was applied to project current 2026 compensation. Percentile ranges (P10–P90) represent the full salary distribution across experience levels and practice settings in this market.
Data Sources & Methodology
Source: BLS, OEWS, 6-year dataset (–). Per-city data from annual BLS metropolitan area surveys.
2026 figures are projected from 2025 BLS data using a compound annual growth rate (CAGR) of 2.46%, derived from historical BLS wage trends for physical therapists (SOC 29-1123).
Compiled and verified by Alex Morgan, DPT, a licensed physical therapist with 10+ years of clinical experience. · View source data at BLS.gov