Physical Therapist Salary in Richmond, IN: $98,147 (2026)
Quick Answer:A full-time physical therapist in Richmond, IN earns a median $98,147/year (≈ $47.18/hour) in nominal terms for 2026 — projected from BLS OEWS 2025 (SOC 29-1123). Once you factor in Richmond's price level (9% below national, BEA RPP 91.3), that paycheck buys what $107,499 would nationally. Nominal pay sits 2.7% below the Indiana state average.
Based on BLS state-level estimates · View source
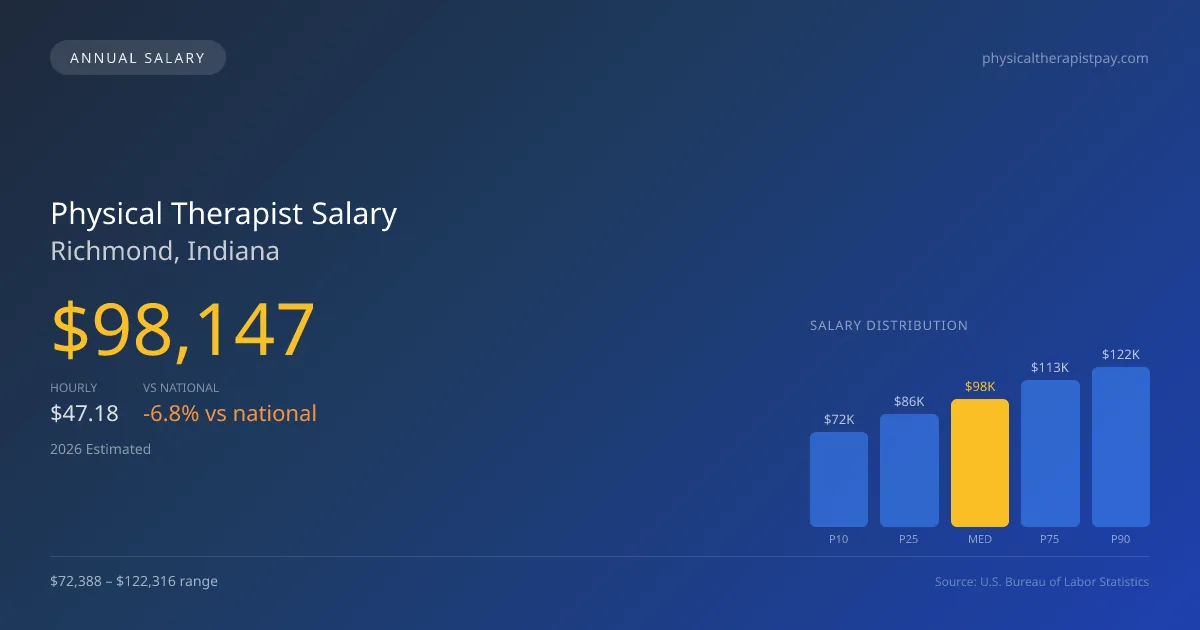
In 2026, physical therapists in Richmond, IN, are projected to earn a median annual salary of $98,147, which reflects the local market conditions and productivity pressures inherent in the profession. This salary falls within a broader range, with earnings varying from $72,388 at the 10th percentile to $122,316 at the 90th percentile. The estimates here are derived from 2025 BLS data adjusted for regional cost of living factors, indicating that the expected income for physical therapy roles is slightly below the national median of $105,288. In Richmond, the dynamics of patient visits per day heavily influence compensation, demonstrating how productivity expectations shape overall pay.
About the Richmond Market
Salary estimated from Indiana average ($92,000) adjusted for local cost of living.
Salary Breakdown
| Percentile | Annual | Hourly |
|---|---|---|
| Entry Level (P10) | $72,388 | $34.81 |
| Lower Range (P25) | $86,459 | $41.57 |
| Median (P50)(typical) | $98,147 | $47.18 |
| Upper Range (P75) | $112,640 | $54.15 |
| Top Earners (P90) | $122,316 | $58.80 |
Median Salary Position
6.78% below the national average
2026 Salary Percentile Distribution in Richmond
In Richmond, IN, the physical therapist salary spread from the 10th to 90th percentile is $49,928 (2026 est.). At $98,147, the local median is 6.78% below the national median of $105,288.
Salary Calculator
At 40 hours/week in Richmond: You'd be above the median
How Richmond Physical Therapist Pay Compares
Richmond median: $98,147/year (2026)
| Compared To | Median Salary | Richmond Pays |
|---|---|---|
| Indiana Average | $100,871 | -2.70% less |
| National Average | $105,288 | -6.78% less |
Physical Therapists in Richmond, IN earn a median of $98,147 per year (2026 est.), which is 6.78% lower than the national median of $105,288 and 2.70% below the Indiana state average of $100,871.
Cost-of-Living Adjusted Salary
Richmond has a cost of living 8.70% below the national average, meaning your salary goes further here.
Adjusted salary = nominal × (100 / CoL index). CoL index: 100 = national average.
Richmond, IN has a cost-of-living index of 91.3 (below the national average of 100). A physical therapist earning $98,147 nominally has purchasing power equivalent to $107,499 in an average-cost city — an effective 9.53% boost.
Compare Purchasing Power
Select a city to see how your salary compares after cost of living
Select a city above to compare purchasing power
2019 BLS Actual
$83,374
2025 BLS Actual
$95,791
2026 Current Est.
$98,147
2019–2027 Growth
+20.6%
Salary Trajectory for Physical Therapists in Richmond (2019–2027)
2019–2025: actual BLS OEWS data for this metro area. 2026+: CAGR 2.46% projection.
| Year | Annual Salary | Status |
|---|---|---|
| 2019 | $83,374 | Actual |
| 2020 | $84,838 | Actual |
| 2021 | $89,135 | Actual |
| 2022 | $91,093 | Actual |
| 2023 | $92,948 | Actual |
| 2024 | $81,740 | Actual |
| 2025 | $95,791 | Actual |
| 2026(current) | $98,147 | Estimated |
| 2027 | $100,562 | Projected |
Based on 7 years of BLS OEWS data for the Richmond metropolitan area, the median physical therapist salary grew 14.9% from $83,374 (2019) to $95,791 (2025). At a 2.46% compound annual growth rate, salaries are projected to reach $100,562 by 2027 — a total increase of $17,188 (20.62%) from 2019.
Note: Historical values (2019–2025) are actual BLS OEWS figures for the Richmond metropolitan area, sourced from annual Occupational Employment and Wage Statistics surveys. 2026–2026 figures are current estimates, and 2027 values are projections, calculated using a 2.46% CAGR derived from 7-year BLS historical data. Actual salaries may vary based on employer, experience, certifications, and local market conditions.
Salary by Experience Level
| Experience | Estimated Salary Range |
|---|---|
| 0-2 years (New Graduate) | $72,388 – $86,459 |
| 3-5 years (Mid Career) | $86,459 – $98,147 |
| 5+ years (Experienced) | $98,147 – $112,640 |
| 10+ years (Top Earner) | $112,640 – $122,316 |
PT salary ranges estimated from BLS percentile data. Individual physical therapist compensation varies by employer, certifications, and specialization.
Physical Therapist Job Market in Richmond
The job market for physical therapists in Richmond employs seven professionals, highlighting a localized workforce that may face competitive pressures. With the cost of living index reported at 91.3, physical therapist pay in Richmond IN offers a respectable take-home purchasing power compared to many other markets. The salary variations in the area can largely be attributed to the type of employment setting; outpatient orthopedic clinics, including chains like Athletico and ATI, may offer lower base salaries than hospital systems, but can compensate with performance bonuses tied to productivity. Factors such as board certifications and differing practice models also play a significant role in determining individual salaries. For those seeking to maximize their earnings, focusing on specialized certifications like OCS or SCS and exploring cash-pay models can provide an advantage in achieving higher compensation in the Richmond market.
More salary data for Richmond, IN:
Frequently Asked Questions
How much do physical therapists make in Richmond, IN in 2026?
Is Richmond, IN a good place to work as a physical therapist?
Can physical therapists make $100K in Richmond?
What is the cost-of-living adjusted physical therapist salary in Richmond?
How much does a physical therapist make per hour in Richmond?
Related Pages
Compare Salaries
Career Resources
Nearby Cities in Indiana
Written by Alex Morgan, DPT
Career Analyst
Alex Morgan has over 10 years of experience in physical therapy. They specialize in orthopedic rehabilitation. Alex works in a private practice setting.
Methodology & Data Source
Salary figures on this page are 2026 projections based on the Bureau of Labor Statistics Occupational Employment and Wage Statistics (OEWS) survey, May 2026 release. The BLS reported a median annual salary of $95,791 for physical therapistsin the Richmond metropolitan area. A 2.46% compound annual growth rate (CAGR), calculated from 6-year national BLS wage trends, was applied to project current 2026 compensation. Percentile ranges (P10–P90) represent the full salary distribution across experience levels and practice settings in this market.
Data Sources & Methodology
Salary data for Richmond is estimated from official BLS state-level occupational wage data (2025), adjusted for regional cost-of-living differences using BEA RPP (Regional Price Parities).
2026 figures are projected from 2025 BLS data using a compound annual growth rate (CAGR) of 2.46%, derived from historical BLS wage trends for physical therapists (SOC 29-1123).
Compiled and verified by Alex Morgan, DPT, a licensed physical therapist with 10+ years of clinical experience. · View source data at BLS.gov