Physical Therapist Salary in Manhattan, KS: $99,499 (2026)
Quick Answer:A full-time physical therapist in Manhattan, KS earns a median $99,499/year (≈ $47.84/hour) in nominal terms for 2026 — projected from BLS OEWS 2025 (SOC 29-1123). Once you factor in Manhattan's price level (10% below national, BEA RPP 90.2), that paycheck buys what $110,356 would nationally. Nominal pay sits 4.0% above the Kansas state average.
Official BLS data · View source
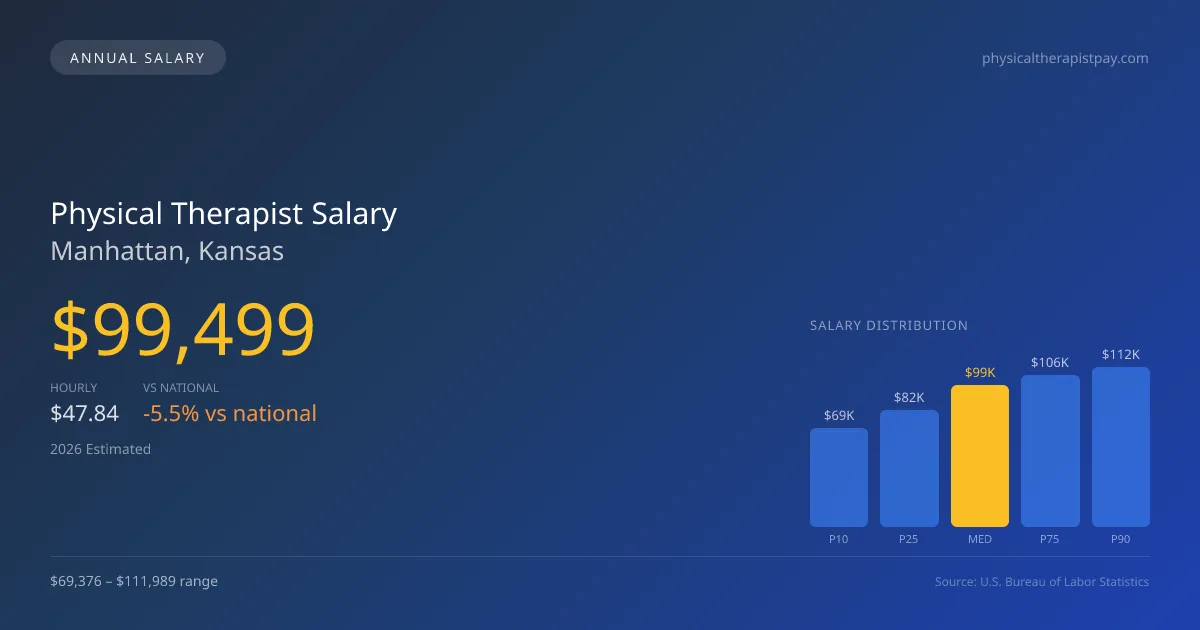
In 2026, the physical therapist salary in Manhattan, Kansas, is projected to reach a median annual figure of $99,499, slightly below the national median of $105,288. The salary range for physical therapists in this city spans from $69,376 at the 10th percentile to $111,989 at the 90th percentile, reflecting considerable variation in earnings based on experience, setting, and productivity expectations. This data, derived from 2025 BLS OEWS surveys and projected into 2026, indicates that therapists in Manhattan need to balance effective compensation strategies with the intensive demands of their roles, where visits per day significantly influence compensation rates. As a result, an understanding of the local job market dynamics is key for those exploring careers in physical therapy in this vibrant Kansas city.
Salary Breakdown
| Percentile | Annual | Hourly |
|---|---|---|
| Entry Level (P10) | $69,376 | $33.35 |
| Lower Range (P25) | $82,101 | $39.48 |
| Median (P50)(typical) | $99,499 | $47.84 |
| Upper Range (P75) | $106,138 | $51.03 |
| Top Earners (P90) | $111,989 | $53.84 |
Median Salary Position
5.5% below the national average
2026 Salary Percentile Distribution in Manhattan
In Manhattan, KS, the physical therapist salary spread from the 10th to 90th percentile is $42,613 (2026 est.). At $99,499, the local median is 5.5% below the national median of $105,288.
Salary Calculator
At 40 hours/week in Manhattan: You'd be above the median
How Manhattan Physical Therapist Pay Compares
Manhattan median: $99,499/year (2026)
| Compared To | Median Salary | Manhattan Pays |
|---|---|---|
| Kansas Average | $95,672 | +4.00% more |
| National Average | $105,288 | -5.50% less |
Physical Therapists in Manhattan, KS earn a median of $99,499 per year (2026 est.), which is 5.50% lower than the national median of $105,288 and 4.00% above the Kansas state average of $95,672.
Cost-of-Living Adjusted Salary
Manhattan has a cost of living 9.84% below the national average, meaning your salary goes further here.
Adjusted salary = nominal × (100 / CoL index). CoL index: 100 = national average.
Manhattan, KS has a cost-of-living index of 90.162 (below the national average of 100). A physical therapist earning $99,499 nominally has purchasing power equivalent to $110,356 in an average-cost city — an effective 10.91% boost.
Compare Purchasing Power
Select a city to see how your salary compares after cost of living
Select a city above to compare purchasing power
2019 BLS Actual
$79,100
2025 BLS Actual
$97,110
2026 Current Est.
$99,499
2019–2027 Growth
+28.9%
Salary Trajectory for Physical Therapists in Manhattan (2019–2027)
2019–2025: actual BLS OEWS data for this metro area. 2026+: CAGR 2.46% projection.
| Year | Annual Salary | Status |
|---|---|---|
| 2019 | $79,100 | Actual |
| 2020 | $73,350 | Actual |
| 2021 | $76,890 | Actual |
| 2022 | $79,170 | Actual |
| 2023 | $83,960 | Actual |
| 2024 | $96,610 | Actual |
| 2025 | $97,110 | Actual |
| 2026(current) | $99,499 | Estimated |
| 2027 | $101,947 | Projected |
Based on 7 years of BLS OEWS data for the Manhattan metropolitan area, the median physical therapist salary grew 22.8% from $79,100 (2019) to $97,110 (2025). At a 2.46% compound annual growth rate, salaries are projected to reach $101,947 by 2027 — a total increase of $22,847 (28.88%) from 2019.
Note: Historical values (2019–2025) are actual BLS OEWS figures for the Manhattan metropolitan area, sourced from annual Occupational Employment and Wage Statistics surveys. 2026–2026 figures are current estimates, and 2027 values are projections, calculated using a 2.46% CAGR derived from 7-year BLS historical data. Actual salaries may vary based on employer, experience, certifications, and local market conditions.
Salary by Experience Level
| Experience | Estimated Salary Range |
|---|---|
| 0-2 years (New Graduate) | $69,376 – $82,101 |
| 3-5 years (Mid Career) | $82,101 – $99,499 |
| 5+ years (Experienced) | $99,499 – $106,138 |
| 10+ years (Top Earner) | $106,138 – $111,989 |
PT salary ranges estimated from BLS percentile data. Individual physical therapist compensation varies by employer, certifications, and specialization.
Physical Therapist Job Market in Manhattan
Looking at the local job market, there are about 90 physical therapists employed in Manhattan, which complements the area's cost-of-living index of 90.162, indicating a below-average living expense compared to national figures. This affects take-home purchasing power and provides some relief against rising costs. The highest-paying employers in Manhattan are typically outpatient orthopedic clinics, including larger chains such as Athletico and ATI, along with hospital systems that often offer better benefits and pay structures. Variability in compensation for physical therapist pay in Manhattan, KS, is driven by several factors, including productivity benchmarks, board certification stipends, and the distinction between cash-pay versus insurance-based practices. To maximize their earning potential, therapists can pursue board specs like OCS or SCS, consider entering high-demand settings, and staying adaptable to changing market conditions.
More salary data for Manhattan, KS:
Frequently Asked Questions
How much do physical therapists make in Manhattan, KS in 2026?
Is Manhattan, KS a good place to work as a physical therapist?
Can physical therapists make $100K in Manhattan?
What is the cost-of-living adjusted physical therapist salary in Manhattan?
How much does a physical therapist make per hour in Manhattan?
Related Pages
Compare Salaries
Career Resources
Nearby Cities in Kansas
Written by Alex Morgan, DPT
Career Analyst
Alex Morgan has over 10 years of experience in physical therapy. They specialize in orthopedic rehabilitation. Alex works in a private practice setting.
Methodology & Data Source
Salary figures on this page are 2026 projections based on the Bureau of Labor Statistics Occupational Employment and Wage Statistics (OEWS) survey, May 2026 release. The BLS reported a median annual salary of $97,110 for physical therapistsin the Manhattan metropolitan area. A 2.46% compound annual growth rate (CAGR), calculated from 6-year national BLS wage trends, was applied to project current 2026 compensation. Percentile ranges (P10–P90) represent the full salary distribution across experience levels and practice settings in this market.
Data Sources & Methodology
Source: BLS, OEWS, 7-year dataset (–). Per-city data from annual BLS metropolitan area surveys.
2026 figures are projected from 2025 BLS data using a compound annual growth rate (CAGR) of 2.46%, derived from historical BLS wage trends for physical therapists (SOC 29-1123).
Compiled and verified by Alex Morgan, DPT, a licensed physical therapist with 10+ years of clinical experience. · View source data at BLS.gov