Physical Therapist Salary in Baltimore, MD: $108,413 (2026)
Quick Answer:A full-time physical therapist in Baltimore, MD earns a median $108,413/year (≈ $52.12/hour) in nominal terms for 2026 — projected from BLS OEWS 2025 (SOC 29-1123). Once you factor in Baltimore's price level (4% above national, BEA RPP 104.5), that paycheck buys what $103,757 would nationally. Nominal pay sits 5.8% below the Maryland state average.
Official BLS data · View source
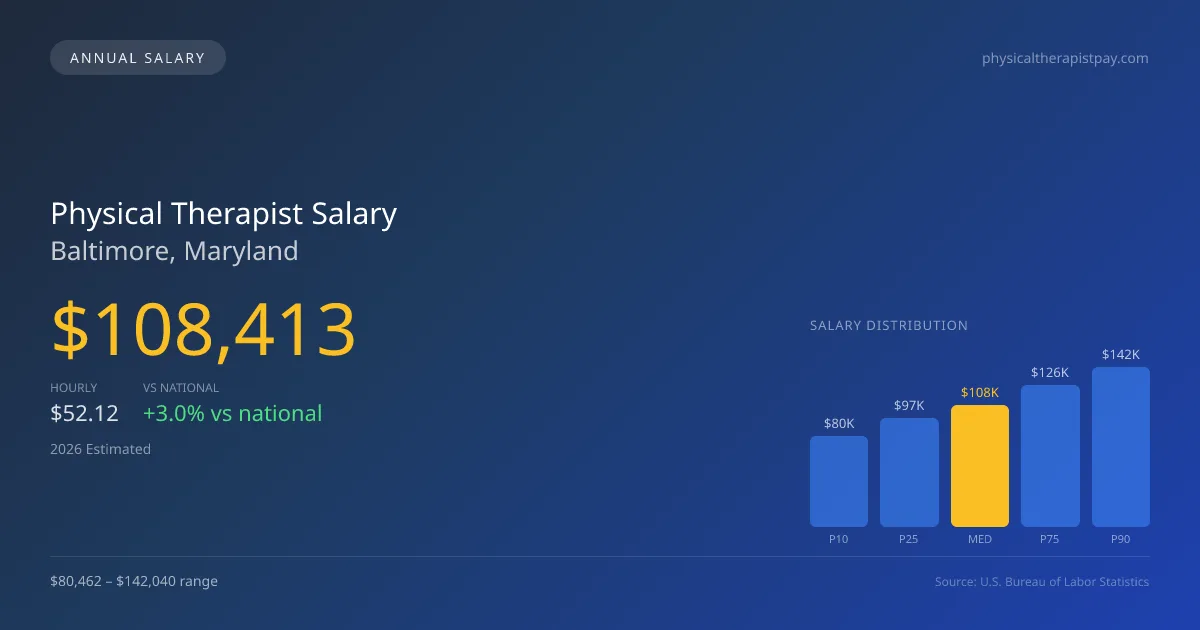
In 2026, the landscape of physical therapist salaries in Baltimore, Maryland, reflects a strong earning potential that aligns closely with national trends. With a median annual salary projected at $108,413, physical therapists in Baltimore can expect to see a salary range from $80,462 at the 10th percentile to $142,040 at the 90th percentile. This data, derived from the official Bureau of Labor Statistics (BLS) surveys, indicates that salary offers are competitive, particularly in an environment where productivity expectations are high. The pressure to meet daily visit quotas often shapes compensation models, making it essential for physical therapists to not only understand their worth but also the demands of their specific practice settings within Baltimore’s job market.
Salary Breakdown
| Percentile | Annual | Hourly |
|---|---|---|
| Entry Level (P10) | $80,462 | $38.68 |
| Lower Range (P25) | $97,091 | $46.68 |
| Median (P50)(typical) | $108,413 | $52.12 |
| Upper Range (P75) | $126,436 | $60.79 |
| Top Earners (P90) | $142,040 | $68.29 |
Median Salary Position
2.97% above the national average
2026 Salary Percentile Distribution in Baltimore
In Baltimore, MD, the physical therapist salary spread from the 10th to 90th percentile is $61,578 (2026 est.). At $108,413, the local median is 2.97% above the national median of $105,288.
Salary Calculator
At 40 hours/week in Baltimore: You'd be in the lower-middle range
How Baltimore Physical Therapist Pay Compares
Baltimore median: $108,413/year (2026)
| Compared To | Median Salary | Baltimore Pays |
|---|---|---|
| Maryland Average | $115,088 | -5.80% less |
| National Average | $105,288 | +2.97% more |
Physical Therapists in Baltimore, MD earn a median of $108,413 per year (2026 est.), which is 2.97% higher than the national median of $105,288 and 5.80% below the Maryland state average of $115,088.
Cost-of-Living Adjusted Salary
Baltimore has a cost of living 4.49% above the national average.
Adjusted salary = nominal × (100 / CoL index). CoL index: 100 = national average.
Baltimore, MD has a cost-of-living index of 104.487 (above the national average of 100). While the nominal salary of $108,413 is competitive, the higher cost of living reduces purchasing power to an effective $103,757 — a 4.29% reduction.
Compare Purchasing Power
Select a city to see how your salary compares after cost of living
Select a city above to compare purchasing power
2019 BLS Actual
$93,430
2025 BLS Actual
$105,810
2026 Current Est.
$108,413
2019–2027 Growth
+18.9%
Salary Trajectory for Physical Therapists in Baltimore (2019–2027)
2019–2025: actual BLS OEWS data for this metro area. 2026+: CAGR 2.46% projection.
| Year | Annual Salary | Status |
|---|---|---|
| 2019 | $93,430 | Actual |
| 2020 | $92,810 | Actual |
| 2021 | $94,640 | Actual |
| 2022 | $95,810 | Actual |
| 2023 | $100,200 | Actual |
| 2024 | $103,440 | Actual |
| 2025 | $105,810 | Actual |
| 2026(current) | $108,413 | Estimated |
| 2027 | $111,080 | Projected |
Based on 7 years of BLS OEWS data for the Baltimore metropolitan area, the median physical therapist salary grew 13.3% from $93,430 (2019) to $105,810 (2025). At a 2.46% compound annual growth rate, salaries are projected to reach $111,080 by 2027 — a total increase of $17,650 (18.89%) from 2019.
Note: Historical values (2019–2025) are actual BLS OEWS figures for the Baltimore metropolitan area, sourced from annual Occupational Employment and Wage Statistics surveys. 2026–2026 figures are current estimates, and 2027 values are projections, calculated using a 2.46% CAGR derived from 7-year BLS historical data. Actual salaries may vary based on employer, experience, certifications, and local market conditions.
Salary by Experience Level
| Experience | Estimated Salary Range |
|---|---|
| 0-2 years (New Graduate) | $80,462 – $97,091 |
| 3-5 years (Mid Career) | $97,091 – $108,413 |
| 5+ years (Experienced) | $108,413 – $126,436 |
| 10+ years (Top Earner) | $126,436 – $142,040 |
PT salary ranges estimated from BLS percentile data. Individual physical therapist compensation varies by employer, certifications, and specialization.
Physical Therapist Job Market in Baltimore
The local job market for physical therapists in Baltimore boasts approximately 2,050 practitioners, indicating a robust demand for skilled professionals. However, the cost of living in Baltimore, reflected by a CoL index of 104.487, can affect take-home purchasing power despite these competitive salaries. Employers in various sectors—ranging from outpatient orthopedic clinics like ATI and Athletico to hospital inpatient rehabilitation—often determine pay scales based on a mix of productivity metrics, board certification stipends, and practice models (cash-pay vs. insurance) that influence physician compensation. The variance between lower and higher salaries is largely driven by expected productivity, such as units per visit and visits per day. To maximize potential earnings in Baltimore, physical therapists should consider pursuing board specialization (such as OCS or SCS certifications), staying updated on payer reimbursement trends, and exploring opportunities with clinics that prioritize productivity bonuses and continuing education support.
More salary data for Baltimore, MD:
Frequently Asked Questions
How much do physical therapists make in Baltimore, MD in 2026?
Is Baltimore, MD a good place to work as a physical therapist?
Can physical therapists make $100K in Baltimore?
What is the cost-of-living adjusted physical therapist salary in Baltimore?
How much does a physical therapist make per hour in Baltimore?
Related Pages
Compare Salaries
Career Resources
Nearby Cities in Maryland
Written by Alex Morgan, DPT
Career Analyst
Alex Morgan has over 10 years of experience in physical therapy. They specialize in orthopedic rehabilitation. Alex works in a private practice setting.
Methodology & Data Source
Salary figures on this page are 2026 projections based on the Bureau of Labor Statistics Occupational Employment and Wage Statistics (OEWS) survey, May 2026 release. The BLS reported a median annual salary of $105,810 for physical therapistsin the Baltimore metropolitan area. A 2.46% compound annual growth rate (CAGR), calculated from 6-year national BLS wage trends, was applied to project current 2026 compensation. Percentile ranges (P10–P90) represent the full salary distribution across experience levels and practice settings in this market.
Data Sources & Methodology
Source: BLS, OEWS, 7-year dataset (–). Per-city data from annual BLS metropolitan area surveys.
2026 figures are projected from 2025 BLS data using a compound annual growth rate (CAGR) of 2.46%, derived from historical BLS wage trends for physical therapists (SOC 29-1123).
Compiled and verified by Alex Morgan, DPT, a licensed physical therapist with 10+ years of clinical experience. · View source data at BLS.gov