Physical Therapist Salary in Massachusetts: $106,363 (2026)
Quick Answer:Across Massachusetts's 59 metropolitan areas, the average median physical therapist pay sits at $106,363/year heading into 2026 — a figure projected from 2025 BLS OEWS wage data for SOC 29-1123. Because Massachusetts sits at BEA RPP 108.5 (9% above the U.S. baseline), that statewide median translates to roughly $98,030 in nationally-comparable purchasing power. Highest-paying metros: Amherst Town ($110,620), Northampton ($109,155), Barnstable Town ($108,110).
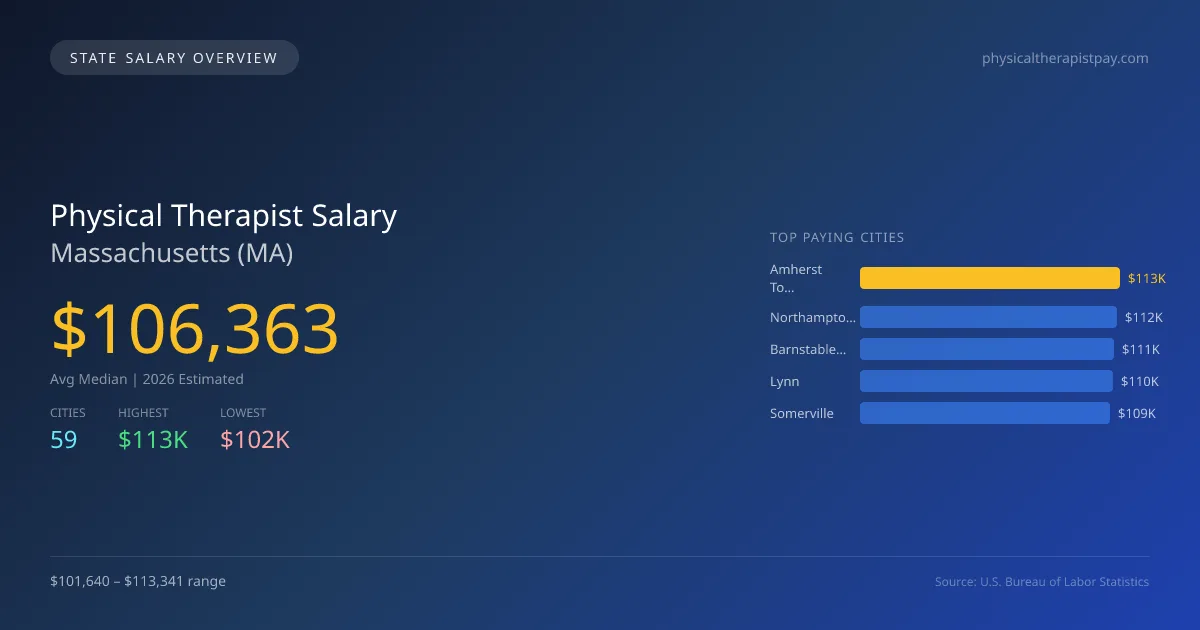
In Massachusetts, physical therapist salaries in 2026 are projected to average $106,364, which is slightly above the national median of $105,288, making Massachusetts about 1.0% higher than the national average. The highest paying city, Amherst Town, offers a salary of $113,341, while Andover presents the lowest at $101,640, illustrating a salary gap of $11,701. This difference can be attributed to variations in cost of living, demand for healthcare services, and funding for physical therapy programs in different regions. Massachusetts has specific state licensing requirements that include completing a Doctor of Physical Therapy (DPT) program and passing a national examination. The state's scope of practice laws allow physical therapists to provide a wide range of services, which drives demand. The job market for physical therapists is expected to grow at an annual compound growth rate of 2.46%, indicating continued opportunities in the field. Prominent cities with strong projected salaries include Northampton at $111,840, Barnstable Town at $110,770, Lynn at $110,255, and Somerville at $108,811. Such salary projections and growth in employment reflect the strong demand for physical therapy services across the state.
Massachusetts Physical Therapist Salary Range
Overall salary range in Massachusetts: $73,808 (lowest entry-level) to $147,874 (highest top earner)
Massachusetts vs National Average
Massachusetts physical therapists earn 1.02% more than the national median (+$1,075/year difference).
Massachusetts Physical Therapist Salary Distribution (2026)
Physical Therapist salaries in Massachusetts range from $82,804 (entry-level, 10th percentile) to $133,176 (top earners, 90th percentile), with a median of $106,363. The Massachusetts median is $1,075 above the US national median of $105,288. The average hourly rate is $51.13/hr. Approximately 7,457 physical therapists are employed across 59 cities.
2019 BLS Actual
$91,223
2025 BLS Actual
$103,810
2026 Current Est.
$106,363
2019–2027 Growth
+19.5%
Salary Trajectory for Physical Therapists in Massachusetts (2019–2027)
2019–2025: actual BLS OEWS data for this metro area. 2026+: CAGR 2.46% projection.
| Year | Annual Salary | Status |
|---|---|---|
| 2019 | $91,223 | Actual |
| 2020 | $88,321 | Actual |
| 2021 | $97,365 | Actual |
| 2022 | $100,085 | Actual |
| 2023 | $101,126 | Actual |
| 2024 | $102,369 | Actual |
| 2025 | $103,810 | Actual |
| 2026(current) | $106,363 | Estimated |
| 2027 | $108,980 | Projected |
Based on 7 years of BLS OEWS data for the Massachusetts metropolitan area, the median physical therapist salary grew 13.8% from $91,223 (2019) to $103,810 (2025). At a 2.46% compound annual growth rate, salaries are projected to reach $108,980 by 2027 — a total increase of $17,757 (19.47%) from 2019.
Note: Historical values (2019–2025) are actual BLS OEWS figures for the Massachusetts metropolitan area, sourced from annual Occupational Employment and Wage Statistics surveys. 2026–2026 figures are current estimates, and 2027 values are projections, calculated using a 2.46% CAGR derived from 7-year BLS historical data. Actual salaries may vary based on employer, experience, certifications, and local market conditions.
Top 5 Highest Paying Cities in Massachusetts
Lowest Paying Cities in Massachusetts
| City | Median Salary |
|---|---|
| Andover | $101,640 |
| Leominster | $101,890 |
| Wellesley | $101,982 |
| Chelmsford | $102,040 |
| Woburn | $102,132 |
Best Value Cities for Physical Therapists in Massachusetts
When adjusted for local cost of living, these Massachusetts cities offer the most purchasing power for physical therapists.
| City | Nominal Salary | CoL Index | Adjusted Salary |
|---|---|---|---|
| Pittsfield | $108,351 | 95.106 | $113,927 |
| Amherst Town | $113,341 | 100.243 | $113,066 |
| Barnstable Town | $110,770 | 98.351 | $112,627 |
| Springfield | $106,118 | 96.061 | $110,469 |
| Worcester | $106,343 | 102.523 | $103,726 |
Adjusted salary = nominal salary × (100 / CoL index). CoL index: 100 = national average. Lower index = lower cost of living.
Salary by Experience Level in Massachusetts
| Experience Level | Estimated Annual |
|---|---|
| Entry Level (0-2 years) | $82,804 |
| Mid Career (3-7 years) | $106,363 |
| Experienced (7+ years) | $133,176 |
Estimates based on BLS percentile data averaged across Massachusetts metro areas. Individual pay varies by employer, certifications, and specialization.
All 59 Cities in Massachusetts
| # | City | Median Salary |
|---|---|---|
| 1 | Amherst Town | $113,341 |
| 2 | Northampton | $111,840 |
| 3 | Barnstable Town | $110,770 |
| 4 | Lynn | $110,255 |
| 5 | Somerville | $108,811 |
| 6 | Revere | $108,641 |
| 7 | Pittsfield | $108,351 |
| 8 | Brockton | $108,269 |
| 9 | New Bedford | $108,148 |
| 10 | Plymouth | $108,081 |
| 11 | Malden | $107,690 |
| 12 | Haverhill | $107,672 |
| 13 | Lowell | $107,644 |
| 14 | Framingham | $107,596 |
| 15 | Peabody | $107,452 |
| 16 | Weymouth | $107,128 |
| 17 | Chicopee | $106,805 |
| 18 | Randolph | $106,689 |
| 19 | Quincy | $106,500 |
| 20 | Amherst | $106,372 |
| 21 | Chelsea | $106,364 |
| 22 | Worcester | $106,343 |
| 23 | Springfield | $106,118 |
| 24 | Boston | $106,097 |
| 25 | Medford | $106,074 |
| 26 | Fall River | $105,972 |
| 27 | Marlborough | $105,972 |
| 28 | Watertown | $105,955 |
| 29 | Fitchburg | $105,872 |
| 30 | Methuen | $105,832 |
| 31 | Taunton | $105,785 |
| 32 | Arlington | $105,747 |
| 33 | Needham | $105,472 |
| 34 | Westfield | $105,422 |
| 35 | Everett | $105,406 |
| 36 | Newton | $105,244 |
| 37 | Holyoke | $104,864 |
| 38 | Beverly | $104,690 |
| 39 | Lawrence | $104,689 |
| 40 | Dartmouth | $104,565 |
| 41 | Waltham | $104,459 |
| 42 | Barnstable | $104,347 |
| 43 | Brookline | $104,119 |
| 44 | Billerica | $103,956 |
| 45 | Braintree | $103,607 |
| 46 | Cambridge | $103,563 |
| 47 | Salem | $103,431 |
| 48 | Natick | $103,365 |
| 49 | Dracut | $102,824 |
| 50 | Lexington | $102,756 |
| 51 | Stoughton | $102,756 |
| 52 | Shrewsbury | $102,623 |
| 53 | Franklin | $102,348 |
| 54 | Attleboro | $102,265 |
| 55 | Woburn | $102,132 |
| 56 | Chelmsford | $102,040 |
| 57 | Wellesley | $101,982 |
| 58 | Leominster | $101,890 |
| 59 | Andover | $101,640 |
More Massachusetts Salary Data
Hourly Rates
Explore physical therapist hourly pay in Massachusetts cities.
Entry Level
Starting salaries for new physical therapists.
Senior / Experienced
Top earner salaries for experienced physical therapists.
Compare Cities in Massachusetts
View all comparisons →Explore More Physical Therapist Salary Data
Frequently Asked Questions
How much do physical therapists make in Massachusetts in 2026?
What is the highest paying city for physical therapists in Massachusetts?
How does Massachusetts physical therapist pay compare to the national average?
What is the entry-level physical therapist salary in Massachusetts?
How many physical therapists are employed in Massachusetts?
Which Massachusetts city offers the best value for physical therapists?
Written by Alex Morgan, DPT
Career Analyst
Alex Morgan has over 10 years of experience in physical therapy. They specialize in orthopedic rehabilitation. Alex works in a private practice setting.
Methodology & Data Source
Statewide salary figures on this page are 2026 projections based on the Bureau of Labor Statistics Occupational Employment and Wage Statistics (OEWS) survey, May 2026 release. A 2.46% compound annual growth rate (CAGR), derived from 6-year national BLS wage trends, was applied to each metro area's reported salary to estimate current 2026 physical therapist compensation across Massachusetts. State averages are employment-weighted across 59 metro areas — larger metro areas with more physical therapistscontribute proportionally more to the average, producing figures that better reflect typical compensation. Individual pay varies by city, employer, certifications, and experience.
Data Sources & Methodology
Source: BLS, OEWS, 7-year dataset (–). Per-city data from annual BLS metropolitan area surveys.
2026 figures are projected from 2025 BLS data using a compound annual growth rate (CAGR) of 2.46%, derived from historical BLS wage trends for physical therapists (SOC 29-1123).
Compiled and verified by Alex Morgan, DPT, a licensed physical therapist with 10+ years of clinical experience. · View source data at BLS.gov