Physical Therapist Salary in Midland, MI: $94,898 (2026)
Quick Answer:A full-time physical therapist in Midland, MI earns a median $94,898/year (≈ $45.63/hour) in nominal terms for 2026 — projected from BLS OEWS 2025 (SOC 29-1123). Once you factor in Midland's price level (8% below national, BEA RPP 91.9), that paycheck buys what $103,239 would nationally. Nominal pay sits 8.9% below the Michigan state average.
Official BLS data · View source
In 2026, the projected median annual salary for physical therapists in Midland, MI is anticipated to reach $94,898, reflecting a 9.87% difference from the national median of $105,288. Salaries in this field demonstrate a notable variability, with the full compensation spectrum ranging from $80,697 at the 10th percentile to $109,970 at the 90th percentile. These figures are derived from official Bureau of Labor Statistics (BLS) OEWS surveys, which indicate a local job market characterized by specific productivity expectations. Such expectations often translate to a higher volume of patient visits per day, impacting effective hourly rates and compensation packages for physical therapists across the Midland region.
Salary Breakdown
| Percentile | Annual | Hourly |
|---|---|---|
| Entry Level (P10) | $80,697 | $38.80 |
| Lower Range (P25) | $90,821 | $43.67 |
| Median (P50)(typical) | $94,898 | $45.63 |
| Upper Range (P75) | $109,970 | $52.87 |
| Top Earners (P90) | $109,970 | $52.87 |
Median Salary Position
9.87% below the national average
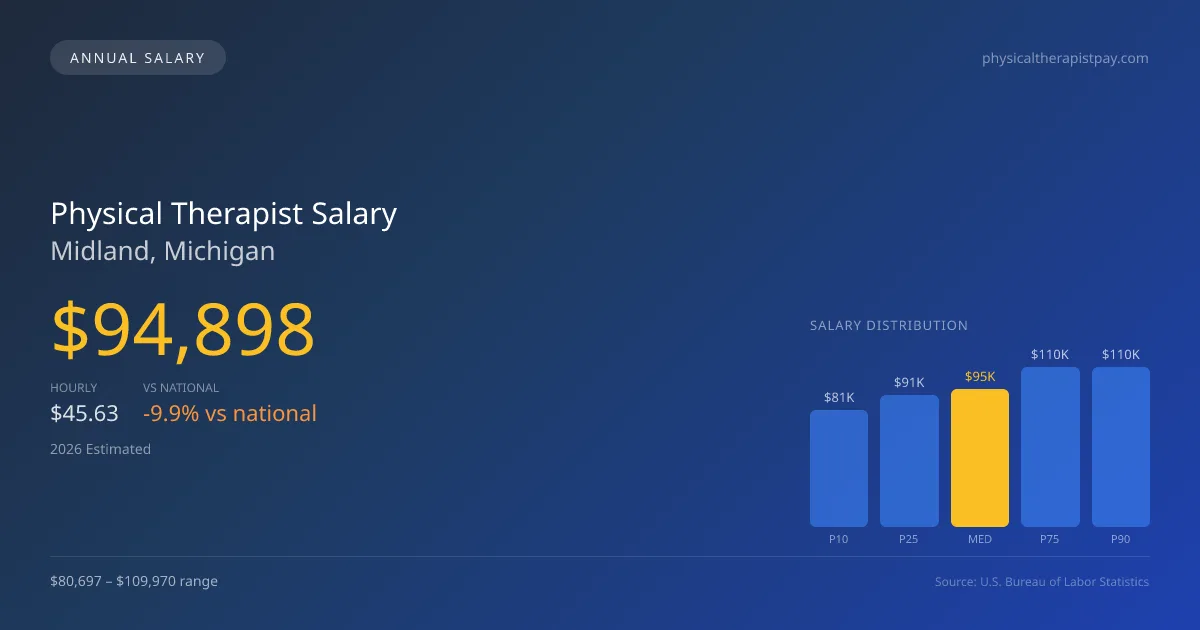
2026 Salary Percentile Distribution in Midland
In Midland, MI, the physical therapist salary spread from the 10th to 90th percentile is $29,273 (2026 est.). At $94,898, the local median is 9.87% below the national median of $105,288.
Salary Calculator
At 40 hours/week in Midland: You'd be in the lower-middle range
How Midland Physical Therapist Pay Compares
Midland median: $94,898/year (2026)
| Compared To | Median Salary | Midland Pays |
|---|---|---|
| Michigan Average | $104,170 | -8.90% less |
| National Average | $105,288 | -9.87% less |
Physical Therapists in Midland, MI earn a median of $94,898 per year (2026 est.), which is 9.87% lower than the national median of $105,288 and 8.90% below the Michigan state average of $104,170.
Cost-of-Living Adjusted Salary
Midland has a cost of living 8.08% below the national average, meaning your salary goes further here.
Adjusted salary = nominal × (100 / CoL index). CoL index: 100 = national average.
Midland, MI has a cost-of-living index of 91.921 (below the national average of 100). A physical therapist earning $94,898 nominally has purchasing power equivalent to $103,239 in an average-cost city — an effective 8.79% boost.
Compare Purchasing Power
Select a city to see how your salary compares after cost of living
Select a city above to compare purchasing power
2019 BLS Actual
$81,490
2025 BLS Actual
$92,620
2026 Current Est.
$94,898
2019–2027 Growth
+19.3%
Salary Trajectory for Physical Therapists in Midland (2019–2027)
2019–2025: actual BLS OEWS data for this metro area. 2026+: CAGR 2.46% projection.
| Year | Annual Salary | Status |
|---|---|---|
| 2019 | $81,490 | Actual |
| 2020 | $72,210 | Actual |
| 2021 | $97,840 | Actual |
| 2022 | $95,600 | Actual |
| 2023 | $99,700 | Actual |
| 2024 | $90,510 | Actual |
| 2025 | $92,620 | Actual |
| 2026(current) | $94,898 | Estimated |
| 2027 | $97,233 | Projected |
Based on 7 years of BLS OEWS data for the Midland metropolitan area, the median physical therapist salary grew 13.7% from $81,490 (2019) to $92,620 (2025). At a 2.46% compound annual growth rate, salaries are projected to reach $97,233 by 2027 — a total increase of $15,743 (19.32%) from 2019.
Note: Historical values (2019–2025) are actual BLS OEWS figures for the Midland metropolitan area, sourced from annual Occupational Employment and Wage Statistics surveys. 2026–2026 figures are current estimates, and 2027 values are projections, calculated using a 2.46% CAGR derived from 7-year BLS historical data. Actual salaries may vary based on employer, experience, certifications, and local market conditions.
Salary by Experience Level
| Experience | Estimated Salary Range |
|---|---|
| 0-2 years (New Graduate) | $80,697 – $90,821 |
| 3-5 years (Mid Career) | $90,821 – $94,898 |
| 5+ years (Experienced) | $94,898 – $109,970 |
| 10+ years (Top Earner) | $109,970 – $109,970 |
PT salary ranges estimated from BLS percentile data. Individual physical therapist compensation varies by employer, certifications, and specialization.
Physical Therapist Job Market in Midland
With around 90 physical therapists currently employed in Midland, the local job market shows relatively stable demand for these healthcare professionals, particularly within the context of a cost-of-living index of 91.921. This index suggests that the purchasing power is advantageous relative to many other areas, potentially enhancing take-home pay for practitioners. Employers offering the most competitive salaries include outpatient orthopedic clinics, hospital inpatient rehabilitation, and sports medicine facilities. The salary variation often hinges on factors such as productivity benchmarks, specific board certifications that may qualify for bonuses, and whether the practice operates on a cash-pay model or relies on insurance reimbursements. For those looking to maximize their compensation, focusing on productivity metrics, considering part-time travel PT positions, or obtaining specialized credentials could significantly enhance earning potential in this regional market.
More salary data for Midland, MI:
Frequently Asked Questions
How much do physical therapists make in Midland, MI in 2026?
Is Midland, MI a good place to work as a physical therapist?
Can physical therapists make $100K in Midland?
What is the cost-of-living adjusted physical therapist salary in Midland?
How much does a physical therapist make per hour in Midland?
Related Pages
Compare Salaries
Career Resources
Nearby Cities in Michigan
Written by Alex Morgan, DPT
Career Analyst
Alex Morgan has over 10 years of experience in physical therapy. They specialize in orthopedic rehabilitation. Alex works in a private practice setting.
Methodology & Data Source
Salary figures on this page are 2026 projections based on the Bureau of Labor Statistics Occupational Employment and Wage Statistics (OEWS) survey, May 2026 release. The BLS reported a median annual salary of $92,620 for physical therapistsin the Midland metropolitan area. A 2.46% compound annual growth rate (CAGR), calculated from 6-year national BLS wage trends, was applied to project current 2026 compensation. Percentile ranges (P10–P90) represent the full salary distribution across experience levels and practice settings in this market.
Data Sources & Methodology
Source: BLS, OEWS, 7-year dataset (–). Per-city data from annual BLS metropolitan area surveys.
2026 figures are projected from 2025 BLS data using a compound annual growth rate (CAGR) of 2.46%, derived from historical BLS wage trends for physical therapists (SOC 29-1123).
Compiled and verified by Alex Morgan, DPT, a licensed physical therapist with 10+ years of clinical experience. · View source data at BLS.gov