Physical Therapist Salary in Niles, MI: $108,628 (2026)
Quick Answer:A full-time physical therapist in Niles, MI earns a median $108,628/year (≈ $52.22/hour) in nominal terms for 2026 — projected from BLS OEWS 2025 (SOC 29-1123). Once you factor in Niles's price level (8% below national, BEA RPP 92.4), that paycheck buys what $117,601 would nationally. Nominal pay sits 4.3% above the Michigan state average.
Official BLS data · View source
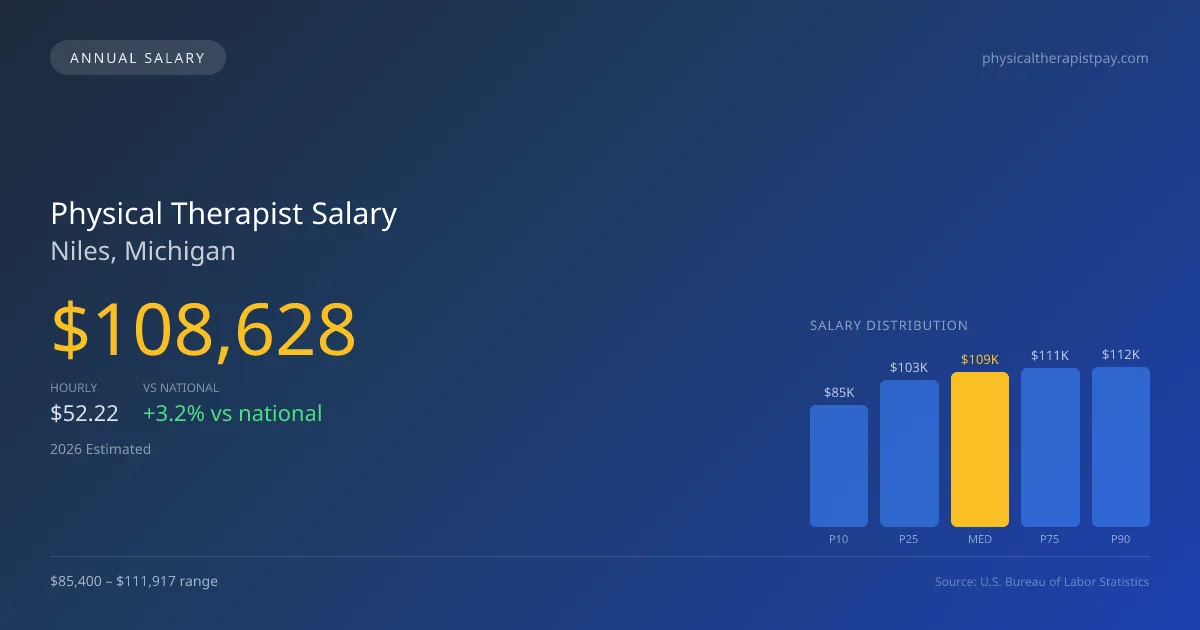
In Niles, MI, the projected median annual salary for physical therapists in 2026 is $108,628, which reflects a competitive edge compared to the national median of $105,288. The salary range for this profession in the area varies significantly, from $85,400 at the 10th percentile to $111,917 at the 90th percentile. These figures are derived from the 2025 Bureau of Labor Statistics (BLS) Occupational Employment and Wage Statistics (OEWS) data, projected to 2026. With employment opportunities typically found across outpatient orthopedic clinics, hospital rehabilitation units, and skilled nursing facilities, the structural choice in healthcare delivery profoundly impacts pay levels. Clinics often prioritize productivity metrics, influencing individual therapist earnings and availability of higher salaries based on practice type and workload.
Salary Breakdown
| Percentile | Annual | Hourly |
|---|---|---|
| Entry Level (P10) | $85,400 | $41.06 |
| Lower Range (P25) | $102,634 | $49.34 |
| Median (P50)(typical) | $108,628 | $52.22 |
| Upper Range (P75) | $110,964 | $53.35 |
| Top Earners (P90) | $111,917 | $53.80 |
Median Salary Position
3.17% above the national average
2026 Salary Percentile Distribution in Niles
In Niles, MI, the physical therapist salary spread from the 10th to 90th percentile is $26,517 (2026 est.). At $108,628, the local median is 3.17% above the national median of $105,288.
Salary Calculator
At 40 hours/week in Niles: You'd be in the upper quartile
How Niles Physical Therapist Pay Compares
Niles median: $108,628/year (2026)
| Compared To | Median Salary | Niles Pays |
|---|---|---|
| Michigan Average | $104,150 | +4.30% more |
| National Average | $105,288 | +3.17% more |
Physical Therapists in Niles, MI earn a median of $108,628 per year (2026 est.), which is 3.17% higher than the national median of $105,288 and 4.30% above the Michigan state average of $104,150.
Cost-of-Living Adjusted Salary
Niles has a cost of living 7.63% below the national average, meaning your salary goes further here.
Adjusted salary = nominal × (100 / CoL index). CoL index: 100 = national average.
Niles, MI has a cost-of-living index of 92.37 (below the national average of 100). A physical therapist earning $108,628 nominally has purchasing power equivalent to $117,601 in an average-cost city — an effective 8.26% boost.
Compare Purchasing Power
Select a city to see how your salary compares after cost of living
Select a city above to compare purchasing power
2019 BLS Actual
$93,350
2025 BLS Actual
$106,020
2026 Current Est.
$108,628
2019–2027 Growth
+19.2%
Salary Trajectory for Physical Therapists in Niles (2019–2027)
2019–2025: actual BLS OEWS data for this metro area. 2026+: CAGR 2.46% projection.
| Year | Annual Salary | Status |
|---|---|---|
| 2019 | $93,350 | Actual |
| 2020 | $81,610 | Actual |
| 2021 | $79,660 | Actual |
| 2022 | $95,490 | Actual |
| 2023 | $98,300 | Actual |
| 2024 | $104,070 | Actual |
| 2025 | $106,020 | Actual |
| 2026(current) | $108,628 | Estimated |
| 2027 | $111,300 | Projected |
Based on 7 years of BLS OEWS data for the Niles metropolitan area, the median physical therapist salary grew 13.6% from $93,350 (2019) to $106,020 (2025). At a 2.46% compound annual growth rate, salaries are projected to reach $111,300 by 2027 — a total increase of $17,950 (19.23%) from 2019.
Note: Historical values (2019–2025) are actual BLS OEWS figures for the Niles metropolitan area, sourced from annual Occupational Employment and Wage Statistics surveys. 2026–2026 figures are current estimates, and 2027 values are projections, calculated using a 2.46% CAGR derived from 7-year BLS historical data. Actual salaries may vary based on employer, experience, certifications, and local market conditions.
Salary by Experience Level
| Experience | Estimated Salary Range |
|---|---|
| 0-2 years (New Graduate) | $85,400 – $102,634 |
| 3-5 years (Mid Career) | $102,634 – $108,628 |
| 5+ years (Experienced) | $108,628 – $110,964 |
| 10+ years (Top Earner) | $110,964 – $111,917 |
PT salary ranges estimated from BLS percentile data. Individual physical therapist compensation varies by employer, certifications, and specialization.
Physical Therapist Job Market in Niles
The local job market in Niles features approximately 80 employed physical therapists, indicating a stable demand for professionals in this field. With a cost-of-living index of 92.37, residents in Niles enjoy a lower-than-average living expense, enhancing the purchasing power of their take-home salaries. Among various employers, outpatient orthopedic clinics, particularly chains like Athletico or ATI, generally offer competitive pay structures alongside productivity bonuses, contrasting with the possibly steadier compensation in hospitals or skilled nursing facilities. Factors such as therapist productivity expectations, board certifications including OCS or SCS, clinic ownership equity, and the cash-pay versus insurance service model contribute to the variability in physical therapist pay in Niles, MI. To maximize earning potential, professionals might consider acquiring specialty certifications or exploring roles in cash-pay clinics, where reimbursement structures can favor higher salaries.
More salary data for Niles, MI:
Frequently Asked Questions
How much do physical therapists make in Niles, MI in 2026?
Is Niles, MI a good place to work as a physical therapist?
Can physical therapists make $100K in Niles?
What is the cost-of-living adjusted physical therapist salary in Niles?
How much does a physical therapist make per hour in Niles?
Related Pages
Compare Salaries
Career Resources
Nearby Cities in Michigan
Written by Alex Morgan, DPT
Career Analyst
Alex Morgan has over 10 years of experience in physical therapy. They specialize in orthopedic rehabilitation. Alex works in a private practice setting.
Methodology & Data Source
Salary figures on this page are 2026 projections based on the Bureau of Labor Statistics Occupational Employment and Wage Statistics (OEWS) survey, May 2026 release. The BLS reported a median annual salary of $106,020 for physical therapistsin the Niles metropolitan area. A 2.46% compound annual growth rate (CAGR), calculated from 6-year national BLS wage trends, was applied to project current 2026 compensation. Percentile ranges (P10–P90) represent the full salary distribution across experience levels and practice settings in this market.
Data Sources & Methodology
Source: BLS, OEWS, 7-year dataset (–). Per-city data from annual BLS metropolitan area surveys.
2026 figures are projected from 2025 BLS data using a compound annual growth rate (CAGR) of 2.46%, derived from historical BLS wage trends for physical therapists (SOC 29-1123).
Compiled and verified by Alex Morgan, DPT, a licensed physical therapist with 10+ years of clinical experience. · View source data at BLS.gov