Physical Therapist Salary in Cape Girardeau, MO: $102,890 (2026)
Quick Answer:A full-time physical therapist in Cape Girardeau, MO earns a median $102,890/year (≈ $49.47/hour) in nominal terms for 2026 — projected from BLS OEWS 2025 (SOC 29-1123). Once you factor in Cape Girardeau's price level (14% below national, BEA RPP 86.1), that paycheck buys what $119,531 would nationally. Nominal pay sits 0.7% above the Missouri state average.
Official BLS data · View source
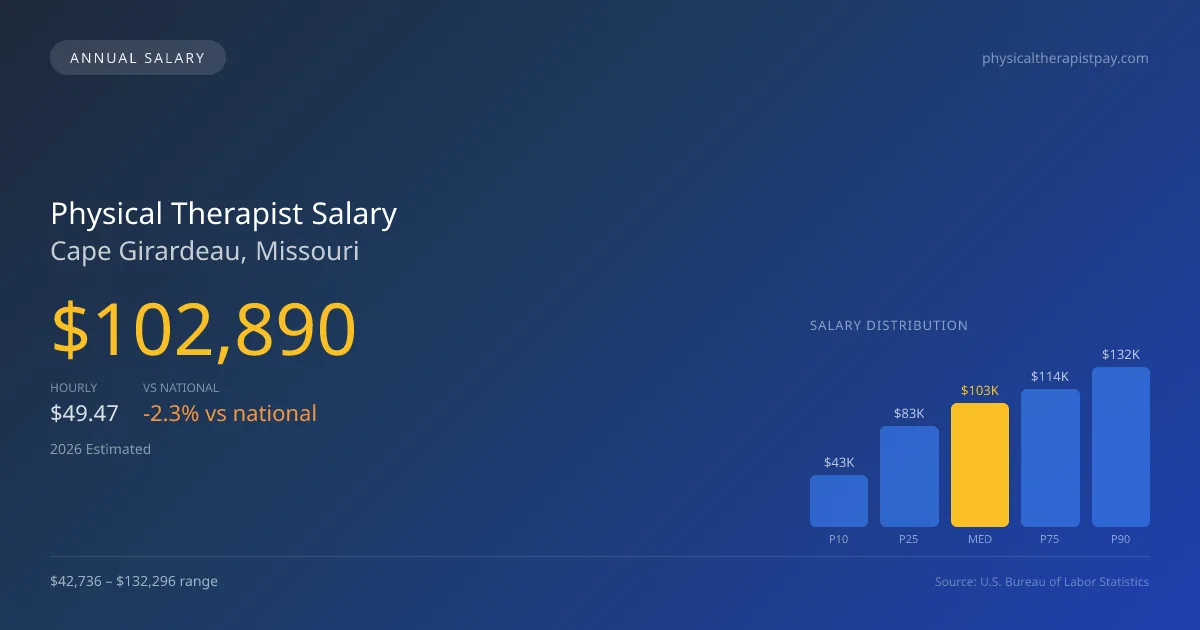
In Cape Girardeau, the average compensation for physical therapists is projected to be $102,890 in 2026, slightly below the national median of $105,288. This salary range varies considerably across the profession, spanning from $42,736 at the lower end to $132,296 for the highest earners. Such figures reflect the evolving landscape of physical therapy, with the cash-pay model for sports and orthopedic specialties increasingly boosting top-end salaries. The insights provided here are derived from official BLS OEWS surveys, which underscore the emergence of refined market dynamics in Cape Girardeau's physical therapy sector as competition ramps up among local providers.
Salary Breakdown
| Percentile | Annual | Hourly |
|---|---|---|
| Entry Level (P10) | $42,736 | $20.55 |
| Lower Range (P25) | $83,116 | $39.96 |
| Median (P50)(typical) | $102,890 | $49.47 |
| Upper Range (P75) | $114,069 | $54.84 |
| Top Earners (P90) | $132,296 | $63.61 |
Median Salary Position
2.28% below the national average
2026 Salary Percentile Distribution in Cape Girardeau
In Cape Girardeau, MO, the physical therapist salary spread from the 10th to 90th percentile is $89,560 (2026 est.). At $102,890, the local median is 2.28% below the national median of $105,288.
Salary Calculator
At 40 hours/week in Cape Girardeau: You'd be above the median
How Cape Girardeau Physical Therapist Pay Compares
Cape Girardeau median: $102,890/year (2026)
| Compared To | Median Salary | Cape Girardeau Pays |
|---|---|---|
| Missouri Average | $102,175 | +0.70% more |
| National Average | $105,288 | -2.28% less |
Physical Therapists in Cape Girardeau, MO earn a median of $102,890 per year (2026 est.), which is 2.28% lower than the national median of $105,288 and 0.70% above the Missouri state average of $102,175.
Cost-of-Living Adjusted Salary
Cape Girardeau has a cost of living 13.92% below the national average, meaning your salary goes further here.
Adjusted salary = nominal × (100 / CoL index). CoL index: 100 = national average.
Cape Girardeau, MO has a cost-of-living index of 86.078 (below the national average of 100). A physical therapist earning $102,890 nominally has purchasing power equivalent to $119,531 in an average-cost city — an effective 16.17% boost.
Compare Purchasing Power
Select a city to see how your salary compares after cost of living
Select a city above to compare purchasing power
2019 BLS Actual
$86,640
2025 BLS Actual
$100,420
2026 Current Est.
$102,890
2019–2027 Growth
+21.7%
Salary Trajectory for Physical Therapists in Cape Girardeau (2019–2027)
2019–2025: actual BLS OEWS data for this metro area. 2026+: CAGR 2.46% projection.
| Year | Annual Salary | Status |
|---|---|---|
| 2019 | $86,640 | Actual |
| 2020 | $85,130 | Actual |
| 2021 | $77,500 | Actual |
| 2022 | $81,310 | Actual |
| 2023 | $92,400 | Actual |
| 2024 | $97,310 | Actual |
| 2025 | $100,420 | Actual |
| 2026(current) | $102,890 | Estimated |
| 2027 | $105,421 | Projected |
Based on 7 years of BLS OEWS data for the Cape Girardeau metropolitan area, the median physical therapist salary grew 15.9% from $86,640 (2019) to $100,420 (2025). At a 2.46% compound annual growth rate, salaries are projected to reach $105,421 by 2027 — a total increase of $18,781 (21.68%) from 2019.
Note: Historical values (2019–2025) are actual BLS OEWS figures for the Cape Girardeau metropolitan area, sourced from annual Occupational Employment and Wage Statistics surveys. 2026–2026 figures are current estimates, and 2027 values are projections, calculated using a 2.46% CAGR derived from 7-year BLS historical data. Actual salaries may vary based on employer, experience, certifications, and local market conditions.
Salary by Experience Level
| Experience | Estimated Salary Range |
|---|---|
| 0-2 years (New Graduate) | $42,736 – $83,116 |
| 3-5 years (Mid Career) | $83,116 – $102,890 |
| 5+ years (Experienced) | $102,890 – $114,069 |
| 10+ years (Top Earner) | $114,069 – $132,296 |
PT salary ranges estimated from BLS percentile data. Individual physical therapist compensation varies by employer, certifications, and specialization.
Physical Therapist Job Market in Cape Girardeau
The local job market for physical therapists has a steady foundation, with around 100 professionals actively working in Cape Girardeau. This equates to a healthy demand for specialized services despite the area’s cost of living index of 86.078, which suggests that the purchasing power of physical therapist salaries may stretch further than in higher-cost regions. Employers like outpatient orthopedic clinics, including major chains and local practices, tend to offer competitive pay structures, often contingent on productivity models. The disparity in earnings within the field can be influenced by factors such as board certification stipends, volume expectations, and practice models. To maximize their salaries, therapists should consider enhancing their qualifications through specialization, exploring cash-pay options, or aligning with employers that value high productivity in their operations, thereby positioning themselves favorably within the Cape Girardeau market.
More salary data for Cape Girardeau, MO:
Frequently Asked Questions
How much do physical therapists make in Cape Girardeau, MO in 2026?
Is Cape Girardeau, MO a good place to work as a physical therapist?
Can physical therapists make $100K in Cape Girardeau?
What is the cost-of-living adjusted physical therapist salary in Cape Girardeau?
How much does a physical therapist make per hour in Cape Girardeau?
Related Pages
Compare Salaries
Career Resources
Nearby Cities in Missouri
Written by Alex Morgan, DPT
Career Analyst
Alex Morgan has over 10 years of experience in physical therapy. They specialize in orthopedic rehabilitation. Alex works in a private practice setting.
Methodology & Data Source
Salary figures on this page are 2026 projections based on the Bureau of Labor Statistics Occupational Employment and Wage Statistics (OEWS) survey, May 2026 release. The BLS reported a median annual salary of $100,420 for physical therapistsin the Cape Girardeau metropolitan area. A 2.46% compound annual growth rate (CAGR), calculated from 6-year national BLS wage trends, was applied to project current 2026 compensation. Percentile ranges (P10–P90) represent the full salary distribution across experience levels and practice settings in this market.
Data Sources & Methodology
Source: BLS, OEWS, 7-year dataset (–). Per-city data from annual BLS metropolitan area surveys.
2026 figures are projected from 2025 BLS data using a compound annual growth rate (CAGR) of 2.46%, derived from historical BLS wage trends for physical therapists (SOC 29-1123).
Compiled and verified by Alex Morgan, DPT, a licensed physical therapist with 10+ years of clinical experience. · View source data at BLS.gov