Physical Therapist Salary in St. Joseph, MO: $101,753 (2026)
Quick Answer:A full-time physical therapist in St. Joseph, MO earns a median $101,753/year (≈ $48.92/hour) in nominal terms for 2026 — projected from BLS OEWS 2025 (SOC 29-1123). Once you factor in St. Joseph's price level (14% below national, BEA RPP 86.4), that paycheck buys what $117,794 would nationally. Nominal pay sits 0.4% below the Missouri state average.
Official BLS data · View source
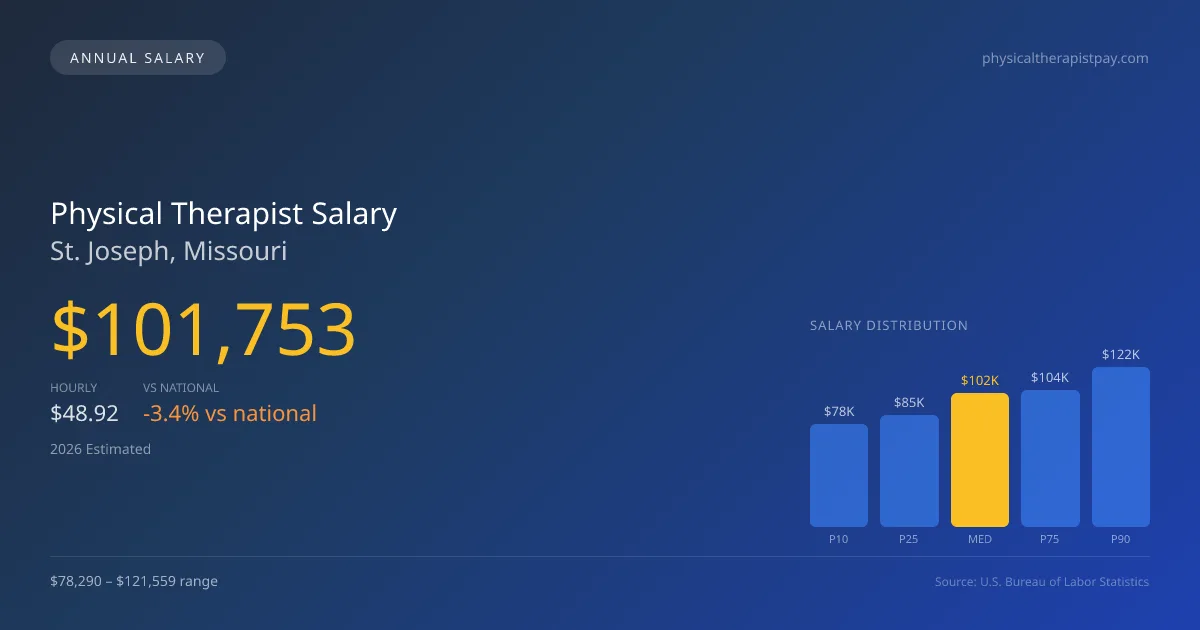
In St. Joseph, Missouri, physical therapists can expect a median annual salary of $101,753, reflecting the financial landscape of the profession in 2026. This salary is nestled within a range from $78,290 at the 10th percentile to $121,559 at the 90th percentile, indicating varying compensation levels across different practice settings. Outpatient chains may offer lower base salaries compared to hospital systems or skilled nursing facilities, but they often provide additional incentives like performance bonuses tied to patient visits. These insights stem from the latest estimates based on 2025 BLS OEWS data, projecting how much do physical therapists make in St. Joseph and contextualizing their earnings against the broader national median of $105,288.
Salary Breakdown
| Percentile | Annual | Hourly |
|---|---|---|
| Entry Level (P10) | $78,290 | $37.64 |
| Lower Range (P25) | $84,868 | $40.80 |
| Median (P50)(typical) | $101,753 | $48.92 |
| Upper Range (P75) | $103,894 | $49.95 |
| Top Earners (P90) | $121,559 | $58.44 |
Median Salary Position
3.36% below the national average
2026 Salary Percentile Distribution in St. Joseph
In St. Joseph, MO, the physical therapist salary spread from the 10th to 90th percentile is $43,269 (2026 est.). At $101,753, the local median is 3.36% below the national median of $105,288.
Salary Calculator
At 40 hours/week in St. Joseph: You'd be above the median
How St. Joseph Physical Therapist Pay Compares
St. Joseph median: $101,753/year (2026)
| Compared To | Median Salary | St. Joseph Pays |
|---|---|---|
| Missouri Average | $102,162 | -0.40% less |
| National Average | $105,288 | -3.36% less |
Physical Therapists in St. Joseph, MO earn a median of $101,753 per year (2026 est.), which is 3.36% lower than the national median of $105,288 and 0.40% below the Missouri state average of $102,162.
Cost-of-Living Adjusted Salary
St. Joseph has a cost of living 13.62% below the national average, meaning your salary goes further here.
Adjusted salary = nominal × (100 / CoL index). CoL index: 100 = national average.
St. Joseph, MO has a cost-of-living index of 86.382 (below the national average of 100). A physical therapist earning $101,753 nominally has purchasing power equivalent to $117,794 in an average-cost city — an effective 15.76% boost.
Compare Purchasing Power
Select a city to see how your salary compares after cost of living
Select a city above to compare purchasing power
2019 BLS Actual
$80,500
2025 BLS Actual
$99,310
2026 Current Est.
$101,753
2019–2027 Growth
+29.5%
Salary Trajectory for Physical Therapists in St. Joseph (2019–2027)
2019–2025: actual BLS OEWS data for this metro area. 2026+: CAGR 2.46% projection.
| Year | Annual Salary | Status |
|---|---|---|
| 2019 | $80,500 | Actual |
| 2020 | $90,420 | Actual |
| 2021 | $80,610 | Actual |
| 2022 | $89,290 | Actual |
| 2023 | $93,130 | Actual |
| 2024 | $101,410 | Actual |
| 2025 | $99,310 | Actual |
| 2026(current) | $101,753 | Estimated |
| 2027 | $104,256 | Projected |
Based on 7 years of BLS OEWS data for the St. Joseph metropolitan area, the median physical therapist salary grew 23.4% from $80,500 (2019) to $99,310 (2025). At a 2.46% compound annual growth rate, salaries are projected to reach $104,256 by 2027 — a total increase of $23,756 (29.51%) from 2019.
Note: Historical values (2019–2025) are actual BLS OEWS figures for the St. Joseph metropolitan area, sourced from annual Occupational Employment and Wage Statistics surveys. 2026–2026 figures are current estimates, and 2027 values are projections, calculated using a 2.46% CAGR derived from 7-year BLS historical data. Actual salaries may vary based on employer, experience, certifications, and local market conditions.
Salary by Experience Level
| Experience | Estimated Salary Range |
|---|---|
| 0-2 years (New Graduate) | $78,290 – $84,868 |
| 3-5 years (Mid Career) | $84,868 – $101,753 |
| 5+ years (Experienced) | $101,753 – $103,894 |
| 10+ years (Top Earner) | $103,894 – $121,559 |
PT salary ranges estimated from BLS percentile data. Individual physical therapist compensation varies by employer, certifications, and specialization.
Physical Therapist Job Market in St. Joseph
The local market is home to about 90 physical therapists, which fosters a competitive environment for employment. With a cost-of-living index of 86.382, practitioners in St. Joseph may enjoy a more favorable purchasing power compared to larger cities, although it remains essential to factor in salary differences. Clinics like ATI and Athletico typically lead in compensation among outpatient providers, while hospitals and skilled nursing facilities can offer pay that fluctuates based on productivity expectations and certification stipends. Strategies to maximize earnings in St. Joseph may include pursuing board specialization like an OCS or SCS, optimizing one's productivity in a high-demand setting, or exploring cash-pay models that often yield higher revenue per patient visit. Understanding these market dynamics can significantly influence potential earnings for physical therapist pay in St. Joseph MO.
More salary data for St. Joseph, MO:
Frequently Asked Questions
How much do physical therapists make in St. Joseph, MO in 2026?
Is St. Joseph, MO a good place to work as a physical therapist?
Can physical therapists make $100K in St. Joseph?
What is the cost-of-living adjusted physical therapist salary in St. Joseph?
How much does a physical therapist make per hour in St. Joseph?
Related Pages
Compare Salaries
Career Resources
Nearby Cities in Missouri
Written by Alex Morgan, DPT
Career Analyst
Alex Morgan has over 10 years of experience in physical therapy. They specialize in orthopedic rehabilitation. Alex works in a private practice setting.
Methodology & Data Source
Salary figures on this page are 2026 projections based on the Bureau of Labor Statistics Occupational Employment and Wage Statistics (OEWS) survey, May 2026 release. The BLS reported a median annual salary of $99,310 for physical therapistsin the St. Joseph metropolitan area. A 2.46% compound annual growth rate (CAGR), calculated from 6-year national BLS wage trends, was applied to project current 2026 compensation. Percentile ranges (P10–P90) represent the full salary distribution across experience levels and practice settings in this market.
Data Sources & Methodology
Source: BLS, OEWS, 7-year dataset (–). Per-city data from annual BLS metropolitan area surveys.
2026 figures are projected from 2025 BLS data using a compound annual growth rate (CAGR) of 2.46%, derived from historical BLS wage trends for physical therapists (SOC 29-1123).
Compiled and verified by Alex Morgan, DPT, a licensed physical therapist with 10+ years of clinical experience. · View source data at BLS.gov