Physical Therapist Salary in Missoula, MT: $86,036 (2026)
Quick Answer:A full-time physical therapist in Missoula, MT earns a median $86,036/year (≈ $41.36/hour) in nominal terms for 2026 — projected from BLS OEWS 2025 (SOC 29-1123). Once you factor in Missoula's price level (4% below national, BEA RPP 96.4), that paycheck buys what $89,207 would nationally. Nominal pay sits 0.5% below the Montana state average.
Official BLS data · View source
In 2026, physical therapists in Missoula, Montana, are projected to earn a median annual salary of $86,036, which is significantly lower than the national median of $105,288. The pay range for this profession in Missoula varies from $80,103 at the 10th percentile to $108,843 at the 90th percentile, as reported in data derived from the Bureau of Labor Statistics (BLS) Occupational Employment and Wage Statistics. Those in outpatient settings may find differing compensation scales compared to those employed by hospitals or skilled nursing facilities, generally reflecting the structural dynamics of each employer. As Missoula's healthcare landscape evolves, professionals need to understand these distinctions to strategize their career paths effectively.
Salary Breakdown
| Percentile | Annual | Hourly |
|---|---|---|
| Entry Level (P10) | $80,103 | $38.51 |
| Lower Range (P25) | $82,900 | $39.86 |
| Median (P50)(typical) | $86,036 | $41.36 |
| Upper Range (P75) | $101,610 | $48.85 |
| Top Earners (P90) | $108,843 | $52.33 |
Median Salary Position
18.29% below the national average
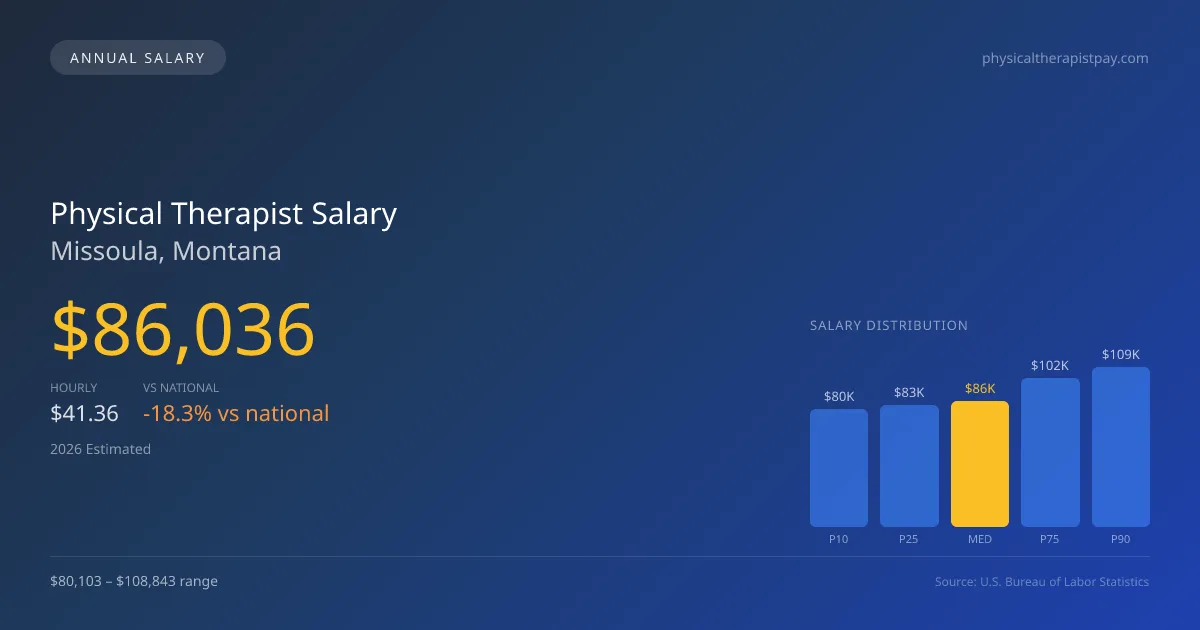
2026 Salary Percentile Distribution in Missoula
In Missoula, MT, the physical therapist salary spread from the 10th to 90th percentile is $28,740 (2026 est.). At $86,036, the local median is 18.29% below the national median of $105,288.
Salary Calculator
At 40 hours/week in Missoula: You'd be in the entry-level range
How Missoula Physical Therapist Pay Compares
Missoula median: $86,036/year (2026)
| Compared To | Median Salary | Missoula Pays |
|---|---|---|
| Montana Average | $86,468 | -0.50% less |
| National Average | $105,288 | -18.29% less |
Physical Therapists in Missoula, MT earn a median of $86,036 per year (2026 est.), which is 18.29% lower than the national median of $105,288 and 0.50% below the Montana state average of $86,468.
Cost-of-Living Adjusted Salary
Missoula has a cost of living 3.56% below the national average, meaning your salary goes further here.
Adjusted salary = nominal × (100 / CoL index). CoL index: 100 = national average.
Missoula, MT has a cost-of-living index of 96.445 (below the national average of 100). A physical therapist earning $86,036 nominally has purchasing power equivalent to $89,207 in an average-cost city — an effective 3.69% boost.
Compare Purchasing Power
Select a city to see how your salary compares after cost of living
Select a city above to compare purchasing power
2019 BLS Actual
$78,320
2025 BLS Actual
$83,970
2026 Current Est.
$86,036
2019–2027 Growth
+12.6%
Salary Trajectory for Physical Therapists in Missoula (2019–2027)
2019–2025: actual BLS OEWS data for this metro area. 2026+: CAGR 2.46% projection.
| Year | Annual Salary | Status |
|---|---|---|
| 2019 | $78,320 | Actual |
| 2020 | $77,640 | Actual |
| 2021 | $78,160 | Actual |
| 2022 | $79,580 | Actual |
| 2023 | $80,950 | Actual |
| 2024 | $82,870 | Actual |
| 2025 | $83,970 | Actual |
| 2026(current) | $86,036 | Estimated |
| 2027 | $88,152 | Projected |
Based on 7 years of BLS OEWS data for the Missoula metropolitan area, the median physical therapist salary grew 7.2% from $78,320 (2019) to $83,970 (2025). At a 2.46% compound annual growth rate, salaries are projected to reach $88,152 by 2027 — a total increase of $9,832 (12.55%) from 2019.
Note: Historical values (2019–2025) are actual BLS OEWS figures for the Missoula metropolitan area, sourced from annual Occupational Employment and Wage Statistics surveys. 2026–2026 figures are current estimates, and 2027 values are projections, calculated using a 2.46% CAGR derived from 7-year BLS historical data. Actual salaries may vary based on employer, experience, certifications, and local market conditions.
Salary by Experience Level
| Experience | Estimated Salary Range |
|---|---|
| 0-2 years (New Graduate) | $80,103 – $82,900 |
| 3-5 years (Mid Career) | $82,900 – $86,036 |
| 5+ years (Experienced) | $86,036 – $101,610 |
| 10+ years (Top Earner) | $101,610 – $108,843 |
PT salary ranges estimated from BLS percentile data. Individual physical therapist compensation varies by employer, certifications, and specialization.
Physical Therapist Job Market in Missoula
The local job market includes approximately 210 physical therapists, providing a relatively stable environment for employment in Missoula. With a cost-of-living index at 96.445, professionals in this city can enjoy a lower living expense compared to national averages, enhancing their overall take-home purchasing power. Among the prominent employers offering competitive pay are outpatient orthopedic clinics and hospital inpatient rehab settings, where the variations in salary often stem from productivity expectations and the specific practice models used. Factors such as board certification stipends or clinic ownership equity also contribute to the range of compensation. For those looking to increase their earnings, pursuing additional certifications like the OCS or SCS, along with actively seeking positions in high-demand areas, could lead to substantial financial benefits in the Missoula market.
More salary data for Missoula, MT:
Frequently Asked Questions
How much do physical therapists make in Missoula, MT in 2026?
Is Missoula, MT a good place to work as a physical therapist?
Can physical therapists make $100K in Missoula?
What is the cost-of-living adjusted physical therapist salary in Missoula?
How much does a physical therapist make per hour in Missoula?
Related Pages
Compare Salaries
Career Resources
Nearby Cities in Montana
Written by Alex Morgan, DPT
Career Analyst
Alex Morgan has over 10 years of experience in physical therapy. They specialize in orthopedic rehabilitation. Alex works in a private practice setting.
Methodology & Data Source
Salary figures on this page are 2026 projections based on the Bureau of Labor Statistics Occupational Employment and Wage Statistics (OEWS) survey, May 2026 release. The BLS reported a median annual salary of $83,970 for physical therapistsin the Missoula metropolitan area. A 2.46% compound annual growth rate (CAGR), calculated from 6-year national BLS wage trends, was applied to project current 2026 compensation. Percentile ranges (P10–P90) represent the full salary distribution across experience levels and practice settings in this market.
Data Sources & Methodology
Source: BLS, OEWS, 7-year dataset (–). Per-city data from annual BLS metropolitan area surveys.
2026 figures are projected from 2025 BLS data using a compound annual growth rate (CAGR) of 2.46%, derived from historical BLS wage trends for physical therapists (SOC 29-1123).
Compiled and verified by Alex Morgan, DPT, a licensed physical therapist with 10+ years of clinical experience. · View source data at BLS.gov