Physical Therapist Salary in Bellevue, NE: $93,288 (2026)
Quick Answer:A full-time physical therapist in Bellevue, NE earns a median $93,288/year (≈ $44.85/hour) in nominal terms for 2026 — projected from BLS OEWS 2025 (SOC 29-1123). Once you factor in Bellevue's price level (8% below national, BEA RPP 91.5), that paycheck buys what $101,954 would nationally. Nominal pay sits 3.2% below the Nebraska state average.
Based on BLS state-level estimates · View source
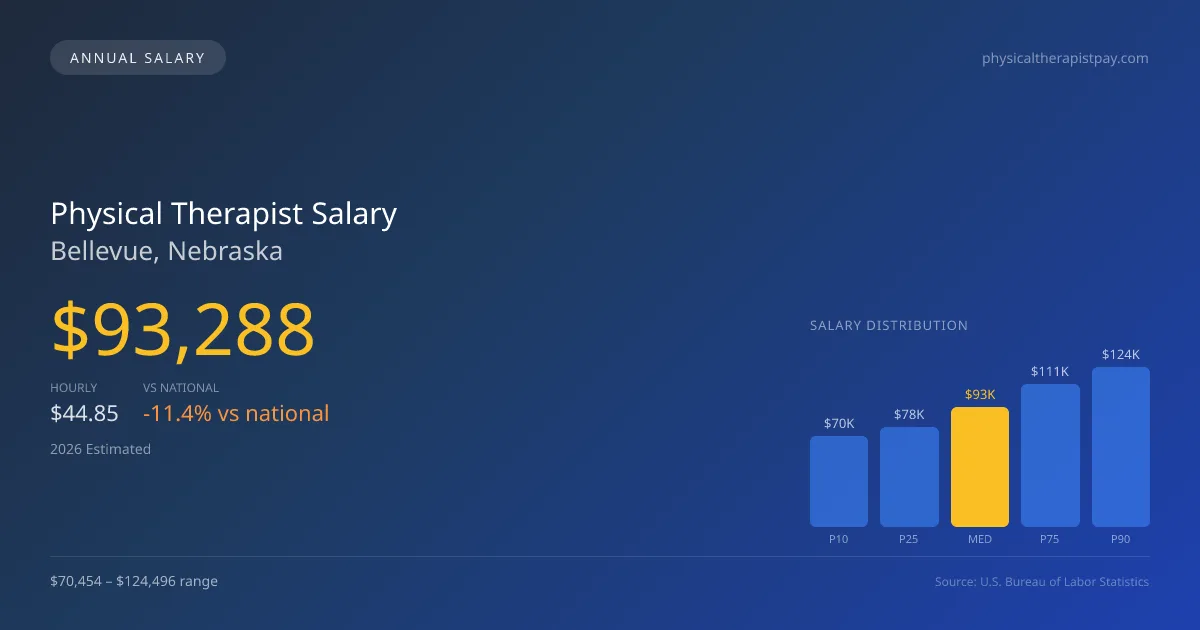
In Bellevue, Nebraska, the projected median annual salary for physical therapists in 2026 is $93,288, which is notably lower than the national median of $105,288. This disparity highlights the relative affordability of life in this region, as salaries reflect both local market conditions and broader economic considerations. The salary distribution ranges from $70,454 at the 10th percentile to $124,496 at the 90th percentile, indicating a diverse spectrum of compensation opportunities in the field. These estimates, derived from 2025 BLS data and adjusted for regional price parity, hint at the competitive nature of specialized areas within physical therapy. As cash-pay models in sports and orthopedic clinics begin to influence higher-end wages, Bellevue’s physical therapy job market may face evolving dynamics that impact future salary trends.
About the Bellevue Market
Salary estimated from Nebraska average ($88,000) adjusted for local cost of living.
Salary Breakdown
| Percentile | Annual | Hourly |
|---|---|---|
| Entry Level (P10) | $70,454 | $33.87 |
| Lower Range (P25) | $78,124 | $37.56 |
| Median (P50)(typical) | $93,288 | $44.85 |
| Upper Range (P75) | $111,492 | $53.60 |
| Top Earners (P90) | $124,496 | $59.86 |
Median Salary Position
11.4% below the national average
2026 Salary Percentile Distribution in Bellevue
In Bellevue, NE, the physical therapist salary spread from the 10th to 90th percentile is $54,042 (2026 est.). At $93,288, the local median is 11.4% below the national median of $105,288.
Salary Calculator
At 40 hours/week in Bellevue: You'd be in the lower-middle range
How Bellevue Physical Therapist Pay Compares
Bellevue median: $93,288/year (2026)
| Compared To | Median Salary | Bellevue Pays |
|---|---|---|
| Nebraska Average | $96,372 | -3.20% less |
| National Average | $105,288 | -11.40% less |
Physical Therapists in Bellevue, NE earn a median of $93,288 per year (2026 est.), which is 11.40% lower than the national median of $105,288 and 3.20% below the Nebraska state average of $96,372.
Cost-of-Living Adjusted Salary
Bellevue has a cost of living 8.50% below the national average, meaning your salary goes further here.
Adjusted salary = nominal × (100 / CoL index). CoL index: 100 = national average.
Bellevue, NE has a cost-of-living index of 91.5 (below the national average of 100). A physical therapist earning $93,288 nominally has purchasing power equivalent to $101,954 in an average-cost city — an effective 9.29% boost.
Compare Purchasing Power
Select a city to see how your salary compares after cost of living
Select a city above to compare purchasing power
2019 BLS Actual
$79,246
2025 BLS Actual
$91,048
2026 Current Est.
$93,288
2019–2027 Growth
+20.6%
Salary Trajectory for Physical Therapists in Bellevue (2019–2027)
2019–2025: actual BLS OEWS data for this metro area. 2026+: CAGR 2.46% projection.
| Year | Annual Salary | Status |
|---|---|---|
| 2019 | $79,246 | Actual |
| 2020 | $80,637 | Actual |
| 2021 | $84,722 | Actual |
| 2022 | $86,582 | Actual |
| 2023 | $88,346 | Actual |
| 2024 | $77,971 | Actual |
| 2025 | $91,048 | Actual |
| 2026(current) | $93,288 | Estimated |
| 2027 | $95,583 | Projected |
Based on 7 years of BLS OEWS data for the Bellevue metropolitan area, the median physical therapist salary grew 14.9% from $79,246 (2019) to $91,048 (2025). At a 2.46% compound annual growth rate, salaries are projected to reach $95,583 by 2027 — a total increase of $16,337 (20.62%) from 2019.
Note: Historical values (2019–2025) are actual BLS OEWS figures for the Bellevue metropolitan area, sourced from annual Occupational Employment and Wage Statistics surveys. 2026–2026 figures are current estimates, and 2027 values are projections, calculated using a 2.46% CAGR derived from 7-year BLS historical data. Actual salaries may vary based on employer, experience, certifications, and local market conditions.
Salary by Experience Level
| Experience | Estimated Salary Range |
|---|---|
| 0-2 years (New Graduate) | $70,454 – $78,124 |
| 3-5 years (Mid Career) | $78,124 – $93,288 |
| 5+ years (Experienced) | $93,288 – $111,492 |
| 10+ years (Top Earner) | $111,492 – $124,496 |
PT salary ranges estimated from BLS percentile data. Individual physical therapist compensation varies by employer, certifications, and specialization.
Physical Therapist Job Market in Bellevue
Employment opportunities in Bellevue are limited, with only 15 physical therapists currently working in the area. The cost-of-living index sits at 91.5, implying that while salaries are lower than the national average, the purchasing power may be relatively favorable for residents. Employers such as outpatient orthopedic clinics, hospital inpatient rehab units, and sports medicine clinics tend to offer the best compensation packages. Factors contributing to variations in pay include productivity expectations, specialized certifications like the OCS or SCS, and the prevailing practice model, whether cash-pay or insurance-based. To maximize physical therapist pay in Bellevue NE, professionals are encouraged to pursue additional credentials, seek roles in higher-paying clinics, and adopt a results-driven approach within their practice.
More salary data for Bellevue, NE:
Frequently Asked Questions
How much do physical therapists make in Bellevue, NE in 2026?
Is Bellevue, NE a good place to work as a physical therapist?
Can physical therapists make $100K in Bellevue?
What is the cost-of-living adjusted physical therapist salary in Bellevue?
How much does a physical therapist make per hour in Bellevue?
Related Pages
Compare Salaries
Career Resources
Nearby Cities in Nebraska
Written by Alex Morgan, DPT
Career Analyst
Alex Morgan has over 10 years of experience in physical therapy. They specialize in orthopedic rehabilitation. Alex works in a private practice setting.
Methodology & Data Source
Salary figures on this page are 2026 projections based on the Bureau of Labor Statistics Occupational Employment and Wage Statistics (OEWS) survey, May 2026 release. The BLS reported a median annual salary of $91,048 for physical therapistsin the Bellevue metropolitan area. A 2.46% compound annual growth rate (CAGR), calculated from 6-year national BLS wage trends, was applied to project current 2026 compensation. Percentile ranges (P10–P90) represent the full salary distribution across experience levels and practice settings in this market.
Data Sources & Methodology
Salary data for Bellevue is estimated from official BLS state-level occupational wage data (2025), adjusted for regional cost-of-living differences using BEA RPP (Regional Price Parities).
2026 figures are projected from 2025 BLS data using a compound annual growth rate (CAGR) of 2.46%, derived from historical BLS wage trends for physical therapists (SOC 29-1123).
Compiled and verified by Alex Morgan, DPT, a licensed physical therapist with 10+ years of clinical experience. · View source data at BLS.gov