Physical Therapist Salary in Norfolk, NE: $89,721 (2026)
Quick Answer:A full-time physical therapist in Norfolk, NE earns a median $89,721/year (≈ $43.14/hour) in nominal terms for 2026 — projected from BLS OEWS 2025 (SOC 29-1123). Once you factor in Norfolk's price level (8% below national, BEA RPP 91.5), that paycheck buys what $98,056 would nationally. Nominal pay sits 6.9% below the Nebraska state average.
Based on BLS state-level estimates · View source
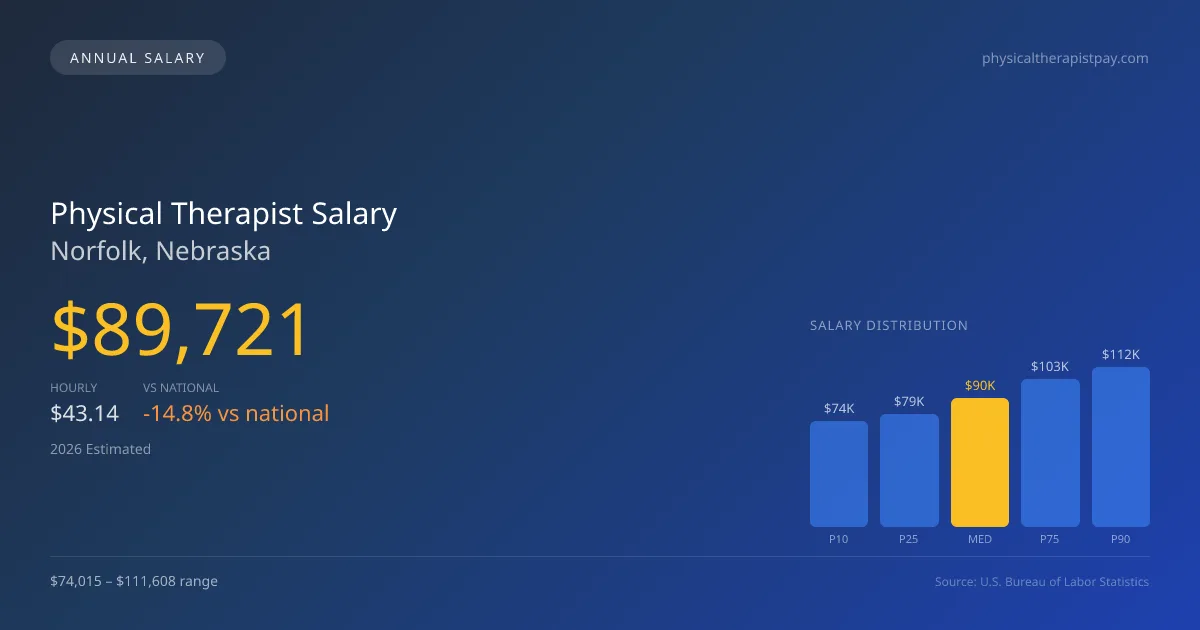
In Norfolk, Nebraska, the expected compensation for physical therapists reflects the choices between outpatient clinics and larger healthcare facilities. With a projected median annual salary of $89,721 for 2026, professionals in this field can anticipate a salary range from $74,015 at the lower end (10th percentile) to $111,608 at the upper end (90th percentile). Local estimates based on 2025 BLS data highlight a notable variance in pay depending on workplace settings, revealing how structural choices significantly impact earnings. While physical therapist pay in Norfolk NE appears lower compared to the national median of $105,288, this local compensation landscape is influenced by the predominance of various employment types, making it essential for job seekers to understand these dynamics.
About the Norfolk Market
Salary estimated from Nebraska average ($88,000) adjusted for local cost of living.
Salary Breakdown
| Percentile | Annual | Hourly |
|---|---|---|
| Entry Level (P10) | $74,015 | $35.58 |
| Lower Range (P25) | $78,901 | $37.93 |
| Median (P50)(typical) | $89,721 | $43.14 |
| Upper Range (P75) | $103,378 | $49.70 |
| Top Earners (P90) | $111,608 | $53.66 |
Median Salary Position
14.79% below the national average
2026 Salary Percentile Distribution in Norfolk
In Norfolk, NE, the physical therapist salary spread from the 10th to 90th percentile is $37,593 (2026 est.). At $89,721, the local median is 14.79% below the national median of $105,288.
Salary Calculator
At 40 hours/week in Norfolk: You'd be in the lower-middle range
How Norfolk Physical Therapist Pay Compares
Norfolk median: $89,721/year (2026)
| Compared To | Median Salary | Norfolk Pays |
|---|---|---|
| Nebraska Average | $96,371 | -6.90% less |
| National Average | $105,288 | -14.79% less |
Physical Therapists in Norfolk, NE earn a median of $89,721 per year (2026 est.), which is 14.79% lower than the national median of $105,288 and 6.90% below the Nebraska state average of $96,371.
Cost-of-Living Adjusted Salary
Norfolk has a cost of living 8.50% below the national average, meaning your salary goes further here.
Adjusted salary = nominal × (100 / CoL index). CoL index: 100 = national average.
Norfolk, NE has a cost-of-living index of 91.5 (below the national average of 100). A physical therapist earning $89,721 nominally has purchasing power equivalent to $98,056 in an average-cost city — an effective 9.29% boost.
Compare Purchasing Power
Select a city to see how your salary compares after cost of living
Select a city above to compare purchasing power
2019 BLS Actual
$76,216
2025 BLS Actual
$87,567
2026 Current Est.
$89,721
2019–2027 Growth
+20.6%
Salary Trajectory for Physical Therapists in Norfolk (2019–2027)
2019–2025: actual BLS OEWS data for this metro area. 2026+: CAGR 2.46% projection.
| Year | Annual Salary | Status |
|---|---|---|
| 2019 | $76,216 | Actual |
| 2020 | $77,554 | Actual |
| 2021 | $81,483 | Actual |
| 2022 | $83,272 | Actual |
| 2023 | $84,968 | Actual |
| 2024 | $74,989 | Actual |
| 2025 | $87,567 | Actual |
| 2026(current) | $89,721 | Estimated |
| 2027 | $91,928 | Projected |
Based on 7 years of BLS OEWS data for the Norfolk metropolitan area, the median physical therapist salary grew 14.9% from $76,216 (2019) to $87,567 (2025). At a 2.46% compound annual growth rate, salaries are projected to reach $91,928 by 2027 — a total increase of $15,712 (20.62%) from 2019.
Note: Historical values (2019–2025) are actual BLS OEWS figures for the Norfolk metropolitan area, sourced from annual Occupational Employment and Wage Statistics surveys. 2026–2026 figures are current estimates, and 2027 values are projections, calculated using a 2.46% CAGR derived from 7-year BLS historical data. Actual salaries may vary based on employer, experience, certifications, and local market conditions.
Salary by Experience Level
| Experience | Estimated Salary Range |
|---|---|
| 0-2 years (New Graduate) | $74,015 – $78,901 |
| 3-5 years (Mid Career) | $78,901 – $89,721 |
| 5+ years (Experienced) | $89,721 – $103,378 |
| 10+ years (Top Earner) | $103,378 – $111,608 |
PT salary ranges estimated from BLS percentile data. Individual physical therapist compensation varies by employer, certifications, and specialization.
Physical Therapist Job Market in Norfolk
The local job market for physical therapists in Norfolk is relatively small, with only six professionals currently employed in the area. This limited workforce, combined with a cost-of-living index of 91.5, implies that take-home pay can stretch further in this environment than in more expensive areas. Employers that typically offer higher pay include outpatient orthopedic clinics like Athletico and ATI, which may pay less than hospital settings but compensate through productivity bonuses and incentives for achieving high patient volumes. Factors influencing pay disparity include expectations for productivity in visits per day, board certifications like OCS and SCS, and ownership opportunities within clinics. For those looking to maximize their earnings in Norfolk, building a strong patient base, seeking board specialization, and considering employment in cash-pay models could lead to superior compensation in this unique market.
More salary data for Norfolk, NE:
Frequently Asked Questions
How much do physical therapists make in Norfolk, NE in 2026?
Is Norfolk, NE a good place to work as a physical therapist?
Can physical therapists make $100K in Norfolk?
What is the cost-of-living adjusted physical therapist salary in Norfolk?
How much does a physical therapist make per hour in Norfolk?
Related Pages
Compare Salaries
Career Resources
Nearby Cities in Nebraska
Written by Alex Morgan, DPT
Career Analyst
Alex Morgan has over 10 years of experience in physical therapy. They specialize in orthopedic rehabilitation. Alex works in a private practice setting.
Methodology & Data Source
Salary figures on this page are 2026 projections based on the Bureau of Labor Statistics Occupational Employment and Wage Statistics (OEWS) survey, May 2026 release. The BLS reported a median annual salary of $87,567 for physical therapistsin the Norfolk metropolitan area. A 2.46% compound annual growth rate (CAGR), calculated from 6-year national BLS wage trends, was applied to project current 2026 compensation. Percentile ranges (P10–P90) represent the full salary distribution across experience levels and practice settings in this market.
Data Sources & Methodology
Salary data for Norfolk is estimated from official BLS state-level occupational wage data (2025), adjusted for regional cost-of-living differences using BEA RPP (Regional Price Parities).
2026 figures are projected from 2025 BLS data using a compound annual growth rate (CAGR) of 2.46%, derived from historical BLS wage trends for physical therapists (SOC 29-1123).
Compiled and verified by Alex Morgan, DPT, a licensed physical therapist with 10+ years of clinical experience. · View source data at BLS.gov