Physical Therapist Salary in Moore, OK: $93,595 (2026)
Quick Answer:A full-time physical therapist in Moore, OK earns a median $93,595/year (≈ $45.00/hour) in nominal terms for 2026 — projected from BLS OEWS 2025 (SOC 29-1123). Once you factor in Moore's price level (11% below national, BEA RPP 88.9), that paycheck buys what $105,281 would nationally. Nominal pay sits 0.0% above the Oklahoma state average.
Based on BLS state-level estimates · View source
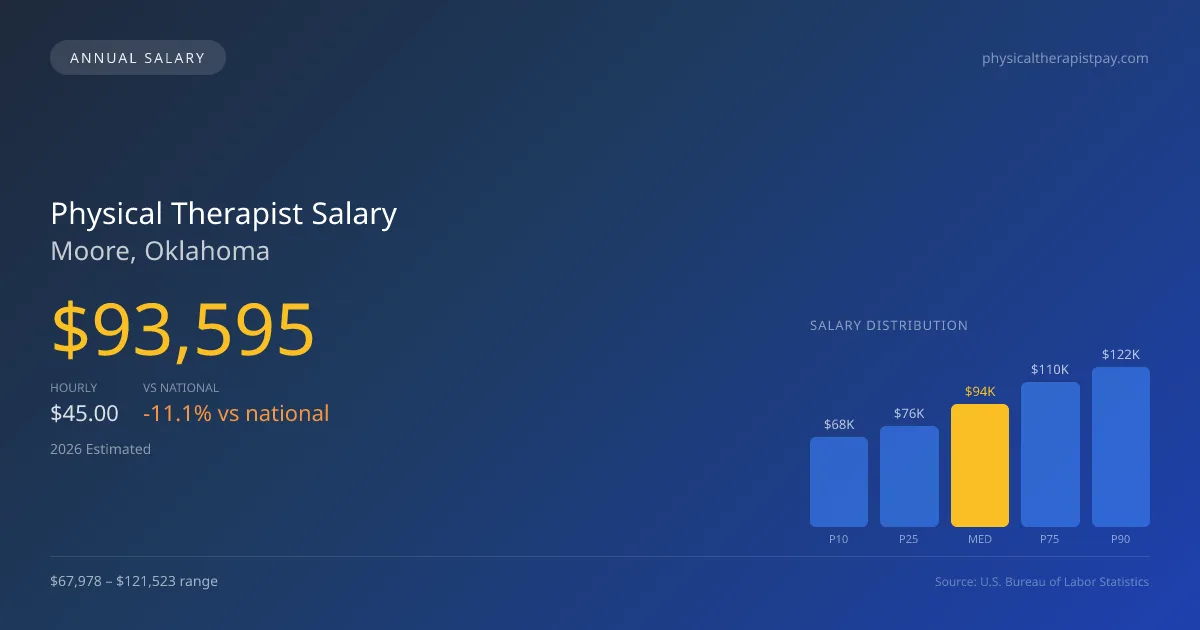
In 2026, physical therapists in Moore, OK, can expect a median annual salary of $93,595, reflecting a competitive market despite a notable gap compared to the national median of $105,288. The salary range for this profession locally falls between $67,978 at the 10th percentile and $121,523 at the 90th percentile. Local estimates derived from BLS data and regional price adjustments indicate that those working in outpatient clinics may often earn less than their counterparts in hospital settings due to differing reimbursement strategies and productivity demands. As the demand for physical therapy services continues to grow in the area, understanding these dynamics will be crucial for new and existing professionals navigating their career paths in Moore's job market.
About the Moore Market
Salary estimated from Oklahoma average ($90,000) adjusted for local cost of living.
Salary Breakdown
| Percentile | Annual | Hourly |
|---|---|---|
| Entry Level (P10) | $67,978 | $32.68 |
| Lower Range (P25) | $76,351 | $36.71 |
| Median (P50)(typical) | $93,595 | $45.00 |
| Upper Range (P75) | $109,829 | $52.80 |
| Top Earners (P90) | $121,523 | $58.42 |
Median Salary Position
11.11% below the national average
2026 Salary Percentile Distribution in Moore
In Moore, OK, the physical therapist salary spread from the 10th to 90th percentile is $53,545 (2026 est.). At $93,595, the local median is 11.11% below the national median of $105,288.
Salary Calculator
At 40 hours/week in Moore: You'd be in the lower-middle range
How Moore Physical Therapist Pay Compares
Moore median: $93,595/year (2026)
| Compared To | Median Salary | Moore Pays |
|---|---|---|
| National Average | $105,288 | -11.11% less |
Physical Therapists in Moore, OK earn a median of $93,595 per year (2026 est.), which is 11.11% lower than the national median of $105,288.
Cost-of-Living Adjusted Salary
Moore has a cost of living 11.10% below the national average, meaning your salary goes further here.
Adjusted salary = nominal × (100 / CoL index). CoL index: 100 = national average.
Moore, OK has a cost-of-living index of 88.9 (below the national average of 100). A physical therapist earning $93,595 nominally has purchasing power equivalent to $105,281 in an average-cost city — an effective 12.49% boost.
Compare Purchasing Power
Select a city to see how your salary compares after cost of living
Select a city above to compare purchasing power
2019 BLS Actual
$79,507
2025 BLS Actual
$91,348
2026 Current Est.
$93,595
2019–2027 Growth
+20.6%
Salary Trajectory for Physical Therapists in Moore (2019–2027)
2019–2025: actual BLS OEWS data for this metro area. 2026+: CAGR 2.46% projection.
| Year | Annual Salary | Status |
|---|---|---|
| 2019 | $79,507 | Actual |
| 2020 | $80,903 | Actual |
| 2021 | $85,001 | Actual |
| 2022 | $86,868 | Actual |
| 2023 | $88,637 | Actual |
| 2024 | $80,005 | Actual |
| 2025 | $91,348 | Actual |
| 2026(current) | $93,595 | Estimated |
| 2027 | $95,898 | Projected |
Based on 7 years of BLS OEWS data for the Moore metropolitan area, the median physical therapist salary grew 14.9% from $79,507 (2019) to $91,348 (2025). At a 2.46% compound annual growth rate, salaries are projected to reach $95,898 by 2027 — a total increase of $16,391 (20.62%) from 2019.
Note: Historical values (2019–2025) are actual BLS OEWS figures for the Moore metropolitan area, sourced from annual Occupational Employment and Wage Statistics surveys. 2026–2026 figures are current estimates, and 2027 values are projections, calculated using a 2.46% CAGR derived from 7-year BLS historical data. Actual salaries may vary based on employer, experience, certifications, and local market conditions.
Salary by Experience Level
| Experience | Estimated Salary Range |
|---|---|
| 0-2 years (New Graduate) | $67,978 – $76,351 |
| 3-5 years (Mid Career) | $76,351 – $93,595 |
| 5+ years (Experienced) | $93,595 – $109,829 |
| 10+ years (Top Earner) | $109,829 – $121,523 |
PT salary ranges estimated from BLS percentile data. Individual physical therapist compensation varies by employer, certifications, and specialization.
Physical Therapist Job Market in Moore
Looking at the local employment context, there are currently 8 physical therapists working in Moore, providing a niche yet stable job market. The cost-of-living index stands at 88.9, suggesting that while salaries may not be as high as the national average, the purchasing power in Moore can be favorable. Employers such as outpatient orthopedic clinics typically pay less than hospital systems, but they may offer productivity bonuses and incentives for board certifications like OCS or SCS, which can significantly impact earnings. Other factors influencing pay disparities include the parameters of insurance reimbursement, clinic visit expectations, and whether therapists can leverage cash-pay models. For those looking to maximize their salary potential in Moore, seeking opportunities in high-performing outpatient chains or enhancing their credentials and specialization could be beneficial strategies.
More salary data for Moore, OK:
Frequently Asked Questions
How much do physical therapists make in Moore, OK in 2026?
Is Moore, OK a good place to work as a physical therapist?
Can physical therapists make $100K in Moore?
What is the cost-of-living adjusted physical therapist salary in Moore?
How much does a physical therapist make per hour in Moore?
Related Pages
Compare Salaries
Career Resources
Nearby Cities in Oklahoma
Written by Alex Morgan, DPT
Career Analyst
Alex Morgan has over 10 years of experience in physical therapy. They specialize in orthopedic rehabilitation. Alex works in a private practice setting.
Methodology & Data Source
Salary figures on this page are 2026 projections based on the Bureau of Labor Statistics Occupational Employment and Wage Statistics (OEWS) survey, May 2026 release. The BLS reported a median annual salary of $91,348 for physical therapistsin the Moore metropolitan area. A 2.46% compound annual growth rate (CAGR), calculated from 6-year national BLS wage trends, was applied to project current 2026 compensation. Percentile ranges (P10–P90) represent the full salary distribution across experience levels and practice settings in this market.
Data Sources & Methodology
Salary data for Moore is estimated from official BLS state-level occupational wage data (2025), adjusted for regional cost-of-living differences using BEA RPP (Regional Price Parities).
2026 figures are projected from 2025 BLS data using a compound annual growth rate (CAGR) of 2.46%, derived from historical BLS wage trends for physical therapists (SOC 29-1123).
Compiled and verified by Alex Morgan, DPT, a licensed physical therapist with 10+ years of clinical experience. · View source data at BLS.gov