Physical Therapist Salary in Hillsboro, OR: $111,341 (2026)
Quick Answer:A full-time physical therapist in Hillsboro, OR earns a median $111,341/year (≈ $53.53/hour) in nominal terms for 2026 — projected from BLS OEWS 2025 (SOC 29-1123). Once you factor in Hillsboro's price level (3% above national, BEA RPP 102.6), that paycheck buys what $108,519 would nationally. Nominal pay sits 6.8% above the Oregon state average.
Based on BLS state-level estimates · View source
In 2026, professionals in the field of physical therapy in Hillsboro, Oregon, can expect a median annual salary of $111,341, which reflects a competitive edge of approximately 5.75% over the national median of $105,288. The full compensation landscape ranges significantly, from a lower tenth percentile earning around $81,838 to the upper ninety percentile making up to $145,910. These figures, based on 2025 BLS data projected to 2026, encompass the realities of a market where productivity expectations significantly influence earning potential. With the demand for effective treatment increasing, the pressure to manage visits per day can shape compensation, making it critical for therapists to align their productivity with the expectations of local employers.
About the Hillsboro Market
Salary estimated from Oregon average ($98,000) adjusted for local cost of living.
Salary Breakdown
| Percentile | Annual | Hourly |
|---|---|---|
| Entry Level (P10) | $81,838 | $39.34 |
| Lower Range (P25) | $91,615 | $44.05 |
| Median (P50)(typical) | $111,341 | $53.53 |
| Upper Range (P75) | $131,294 | $63.13 |
| Top Earners (P90) | $145,910 | $70.14 |
Median Salary Position
5.75% above the national average
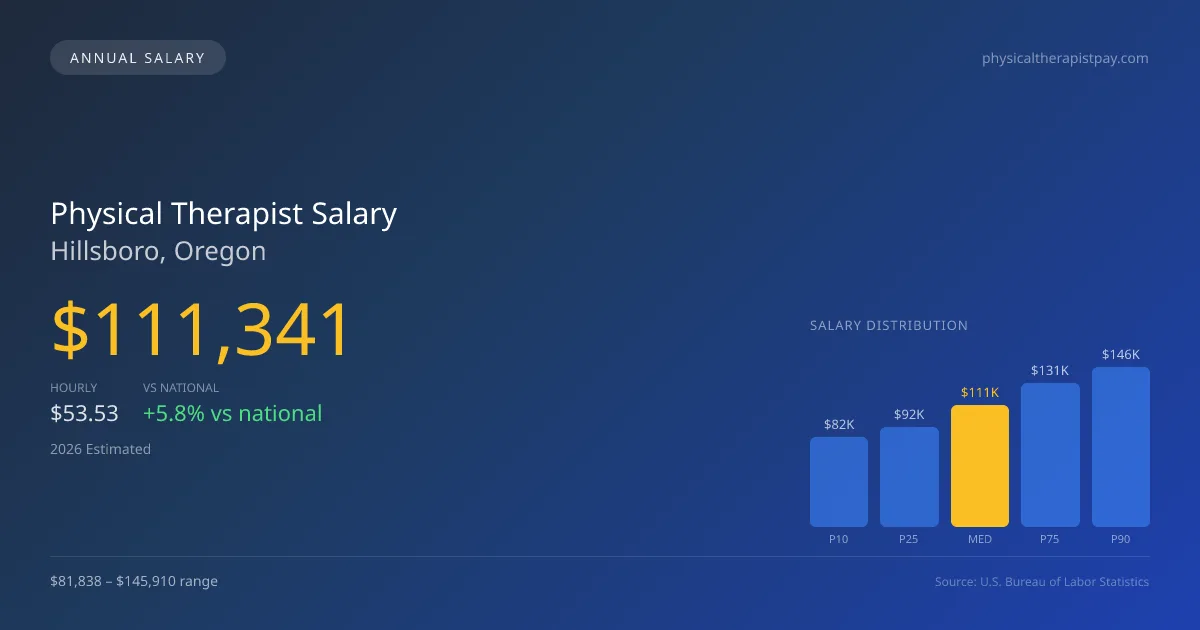
2026 Salary Percentile Distribution in Hillsboro
In Hillsboro, OR, the physical therapist salary spread from the 10th to 90th percentile is $64,072 (2026 est.). At $111,341, the local median is 5.75% above the national median of $105,288.
Salary Calculator
At 40 hours/week in Hillsboro: You'd be in the lower-middle range
How Hillsboro Physical Therapist Pay Compares
Hillsboro median: $111,341/year (2026)
| Compared To | Median Salary | Hillsboro Pays |
|---|---|---|
| Oregon Average | $104,252 | +6.80% more |
| National Average | $105,288 | +5.75% more |
Physical Therapists in Hillsboro, OR earn a median of $111,341 per year (2026 est.), which is 5.75% higher than the national median of $105,288 and 6.80% above the Oregon state average of $104,252.
Cost-of-Living Adjusted Salary
Hillsboro has a cost of living 2.60% above the national average.
Adjusted salary = nominal × (100 / CoL index). CoL index: 100 = national average.
Hillsboro, OR has a cost-of-living index of 102.6 (above the national average of 100). While the nominal salary of $111,341 is competitive, the higher cost of living reduces purchasing power to an effective $108,519 — a 2.53% reduction.
Compare Purchasing Power
Select a city to see how your salary compares after cost of living
Select a city above to compare purchasing power
2019 BLS Actual
$94,582
2025 BLS Actual
$108,668
2026 Current Est.
$111,341
2019–2027 Growth
+20.6%
Salary Trajectory for Physical Therapists in Hillsboro (2019–2027)
2019–2025: actual BLS OEWS data for this metro area. 2026+: CAGR 2.46% projection.
| Year | Annual Salary | Status |
|---|---|---|
| 2019 | $94,582 | Actual |
| 2020 | $96,242 | Actual |
| 2021 | $101,117 | Actual |
| 2022 | $103,338 | Actual |
| 2023 | $105,443 | Actual |
| 2024 | $103,865 | Actual |
| 2025 | $108,668 | Actual |
| 2026(current) | $111,341 | Estimated |
| 2027 | $114,080 | Projected |
Based on 7 years of BLS OEWS data for the Hillsboro metropolitan area, the median physical therapist salary grew 14.9% from $94,582 (2019) to $108,668 (2025). At a 2.46% compound annual growth rate, salaries are projected to reach $114,080 by 2027 — a total increase of $19,498 (20.61%) from 2019.
Note: Historical values (2019–2025) are actual BLS OEWS figures for the Hillsboro metropolitan area, sourced from annual Occupational Employment and Wage Statistics surveys. 2026–2026 figures are current estimates, and 2027 values are projections, calculated using a 2.46% CAGR derived from 7-year BLS historical data. Actual salaries may vary based on employer, experience, certifications, and local market conditions.
Salary by Experience Level
| Experience | Estimated Salary Range |
|---|---|
| 0-2 years (New Graduate) | $81,838 – $91,615 |
| 3-5 years (Mid Career) | $91,615 – $111,341 |
| 5+ years (Experienced) | $111,341 – $131,294 |
| 10+ years (Top Earner) | $131,294 – $145,910 |
PT salary ranges estimated from BLS percentile data. Individual physical therapist compensation varies by employer, certifications, and specialization.
Physical Therapist Job Market in Hillsboro
Hillsboro's job market for physical therapists is characterized by the employment of 22 practitioners, reflecting a niche yet steady demand within the region. The cost of living index sits at 102.6, which indicates a slightly elevated cost of living compared to the national average, impacting overall take-home pay. Among employers, outpatient orthopedic clinics often provide competitive wages but may emphasize high productivity, with chains such as ATI and Athletico commonly offering bonuses tied to performance metrics. Factors such as specialty certifications, like the OCS or SCS, may further widen the salary gap, while the choice between cash-pay and insurance-based practice models directly influences earnings. For therapists aiming to maximize their compensation in Hillsboro OR, focusing on enhancing productivity and pursuing specialized credentials would be prudent strategies.
More salary data for Hillsboro, OR:
Frequently Asked Questions
How much do physical therapists make in Hillsboro, OR in 2026?
Is Hillsboro, OR a good place to work as a physical therapist?
Can physical therapists make $100K in Hillsboro?
What is the cost-of-living adjusted physical therapist salary in Hillsboro?
How much does a physical therapist make per hour in Hillsboro?
Related Pages
Compare Salaries
Career Resources
Nearby Cities in Oregon
Written by Alex Morgan, DPT
Career Analyst
Alex Morgan has over 10 years of experience in physical therapy. They specialize in orthopedic rehabilitation. Alex works in a private practice setting.
Methodology & Data Source
Salary figures on this page are 2026 projections based on the Bureau of Labor Statistics Occupational Employment and Wage Statistics (OEWS) survey, May 2026 release. The BLS reported a median annual salary of $108,668 for physical therapistsin the Hillsboro metropolitan area. A 2.46% compound annual growth rate (CAGR), calculated from 6-year national BLS wage trends, was applied to project current 2026 compensation. Percentile ranges (P10–P90) represent the full salary distribution across experience levels and practice settings in this market.
Data Sources & Methodology
Salary data for Hillsboro is estimated from official BLS state-level occupational wage data (2025), adjusted for regional cost-of-living differences using BEA RPP (Regional Price Parities).
2026 figures are projected from 2025 BLS data using a compound annual growth rate (CAGR) of 2.46%, derived from historical BLS wage trends for physical therapists (SOC 29-1123).
Compiled and verified by Alex Morgan, DPT, a licensed physical therapist with 10+ years of clinical experience. · View source data at BLS.gov