Physical Therapist Salary in Medford, OR: $100,923 (2026)
Quick Answer:A full-time physical therapist in Medford, OR earns a median $100,923/year (≈ $48.51/hour) in nominal terms for 2026 — projected from BLS OEWS 2025 (SOC 29-1123). Once you factor in Medford's price level (1% above national, BEA RPP 101.4), that paycheck buys what $99,497 would nationally. Nominal pay sits 3.2% below the Oregon state average.
Official BLS data · View source
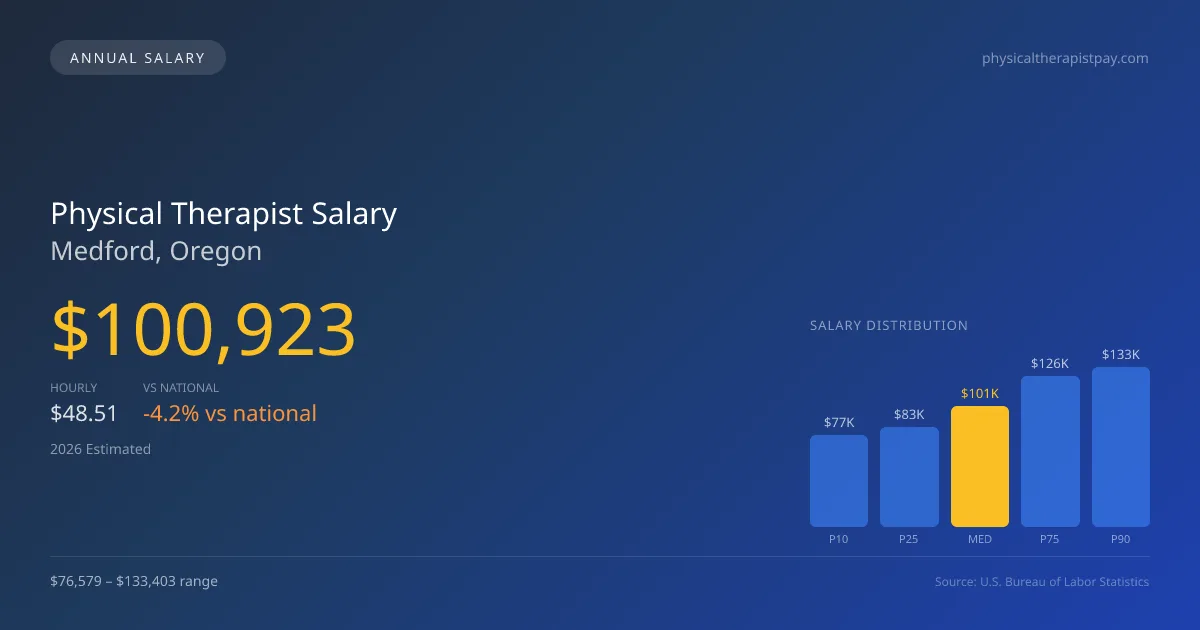
In 2026, physical therapists in Medford, Oregon, are projected to earn a median annual salary of $100,923, which is slightly lower than the national median of $105,288. With a salary range stretching from $76,579 at the 10th percentile to $133,403 at the 90th percentile, compensation varies significantly based on factors such as experience, specialization, and employment setting. These figures derive from comprehensive surveys conducted by the Bureau of Labor Statistics (BLS), highlighting local market dynamics shaped by productivity expectations and patient visit pressures. Medford's physical therapists must effectively manage their case loads to maximize their earnings, a practice that remains essential in a rapidly evolving healthcare environment.
Salary Breakdown
| Percentile | Annual | Hourly |
|---|---|---|
| Entry Level (P10) | $76,579 | $36.81 |
| Lower Range (P25) | $83,290 | $40.04 |
| Median (P50)(typical) | $100,923 | $48.51 |
| Upper Range (P75) | $125,954 | $60.55 |
| Top Earners (P90) | $133,403 | $64.14 |
Median Salary Position
4.15% below the national average
2026 Salary Percentile Distribution in Medford
In Medford, OR, the physical therapist salary spread from the 10th to 90th percentile is $56,824 (2026 est.). At $100,923, the local median is 4.15% below the national median of $105,288.
Salary Calculator
At 40 hours/week in Medford: You'd be in the lower-middle range
How Medford Physical Therapist Pay Compares
Medford median: $100,923/year (2026)
| Compared To | Median Salary | Medford Pays |
|---|---|---|
| Oregon Average | $104,259 | -3.20% less |
| National Average | $105,288 | -4.15% less |
Physical Therapists in Medford, OR earn a median of $100,923 per year (2026 est.), which is 4.15% lower than the national median of $105,288 and 3.20% below the Oregon state average of $104,259.
Cost-of-Living Adjusted Salary
Medford has a cost of living 1.43% above the national average.
Adjusted salary = nominal × (100 / CoL index). CoL index: 100 = national average.
Medford, OR has a cost-of-living index of 101.433 (above the national average of 100). While the nominal salary of $100,923 is competitive, the higher cost of living reduces purchasing power to an effective $99,497 — a 1.41% reduction.
Compare Purchasing Power
Select a city to see how your salary compares after cost of living
Select a city above to compare purchasing power
2019 BLS Actual
$87,230
2025 BLS Actual
$98,500
2026 Current Est.
$100,923
2019–2027 Growth
+18.5%
Salary Trajectory for Physical Therapists in Medford (2019–2027)
2019–2025: actual BLS OEWS data for this metro area. 2026+: CAGR 2.46% projection.
| Year | Annual Salary | Status |
|---|---|---|
| 2019 | $87,230 | Actual |
| 2020 | $92,250 | Actual |
| 2021 | $78,040 | Actual |
| 2022 | $99,320 | Actual |
| 2023 | $100,290 | Actual |
| 2024 | $99,360 | Actual |
| 2025 | $98,500 | Actual |
| 2026(current) | $100,923 | Estimated |
| 2027 | $103,406 | Projected |
Based on 7 years of BLS OEWS data for the Medford metropolitan area, the median physical therapist salary grew 12.9% from $87,230 (2019) to $98,500 (2025). At a 2.46% compound annual growth rate, salaries are projected to reach $103,406 by 2027 — a total increase of $16,176 (18.54%) from 2019.
Note: Historical values (2019–2025) are actual BLS OEWS figures for the Medford metropolitan area, sourced from annual Occupational Employment and Wage Statistics surveys. 2026–2026 figures are current estimates, and 2027 values are projections, calculated using a 2.46% CAGR derived from 7-year BLS historical data. Actual salaries may vary based on employer, experience, certifications, and local market conditions.
Salary by Experience Level
| Experience | Estimated Salary Range |
|---|---|
| 0-2 years (New Graduate) | $76,579 – $83,290 |
| 3-5 years (Mid Career) | $83,290 – $100,923 |
| 5+ years (Experienced) | $100,923 – $125,954 |
| 10+ years (Top Earner) | $125,954 – $133,403 |
PT salary ranges estimated from BLS percentile data. Individual physical therapist compensation varies by employer, certifications, and specialization.
Physical Therapist Job Market in Medford
Analyzing the job market in Medford, there are approximately 160 physical therapists employed in the region, ensuring a competitive landscape for both applicants and employers. The cost of living index sits at 101.433, suggesting that while salaries may be lower compared to national averages, the buying power remains relatively stable. Employers offering the highest compensation often include hospital inpatient rehab centers and specialty sports medicine clinics, which tend to provide better incentives than typical outpatient orthopedic chains. Productivity expectations can drive salary variances, with therapists earning more when they balance unit volumes and insurance reimbursements strategically. For those seeking to enhance their physical therapist pay in Medford, pursuing advanced board certifications like OCS or SCS can yield significant pay increases, while also considering opportunities in cash-pay models or travel PT positions that may offer premium rates.
More salary data for Medford, OR:
Frequently Asked Questions
How much do physical therapists make in Medford, OR in 2026?
Is Medford, OR a good place to work as a physical therapist?
Can physical therapists make $100K in Medford?
What is the cost-of-living adjusted physical therapist salary in Medford?
How much does a physical therapist make per hour in Medford?
Related Pages
Compare Salaries
Career Resources
Nearby Cities in Oregon
Written by Alex Morgan, DPT
Career Analyst
Alex Morgan has over 10 years of experience in physical therapy. They specialize in orthopedic rehabilitation. Alex works in a private practice setting.
Methodology & Data Source
Salary figures on this page are 2026 projections based on the Bureau of Labor Statistics Occupational Employment and Wage Statistics (OEWS) survey, May 2026 release. The BLS reported a median annual salary of $98,500 for physical therapistsin the Medford metropolitan area. A 2.46% compound annual growth rate (CAGR), calculated from 6-year national BLS wage trends, was applied to project current 2026 compensation. Percentile ranges (P10–P90) represent the full salary distribution across experience levels and practice settings in this market.
Data Sources & Methodology
Source: BLS, OEWS, 7-year dataset (–). Per-city data from annual BLS metropolitan area surveys.
2026 figures are projected from 2025 BLS data using a compound annual growth rate (CAGR) of 2.46%, derived from historical BLS wage trends for physical therapists (SOC 29-1123).
Compiled and verified by Alex Morgan, DPT, a licensed physical therapist with 10+ years of clinical experience. · View source data at BLS.gov