Physical Therapist Salary in Missouri City, TX: $107,299 (2026)
Quick Answer:A full-time physical therapist in Missouri City, TX earns a median $107,299/year (≈ $51.59/hour) in nominal terms for 2026 — projected from BLS OEWS 2025 (SOC 29-1123). Once you factor in Missouri City's price level (4% below national, BEA RPP 96.0), that paycheck buys what $111,770 would nationally. Nominal pay sits 0.1% above the Texas state average.
Based on BLS state-level estimates · View source
In Missouri City, Texas, physical therapists can expect a median annual salary of $107,299 in 2026, which slightly surpasses the national median of $105,288. The salary range varies significantly, with entry-level positions (10th percentile) earning around $78,618 and experienced therapists (90th percentile) making up to $146,440. The earnings reflect local estimates derived from 2025 BLS data, adjusted for regional cost variations. Given the predominance of outpatient orthopedic settings, salary trajectories are often influenced by practice type and productivity metrics, making it essential for candidates to understand the local job dynamics.
About the Missouri City Market
Salary estimated from Texas average ($100,000) adjusted for local cost of living.
Salary Breakdown
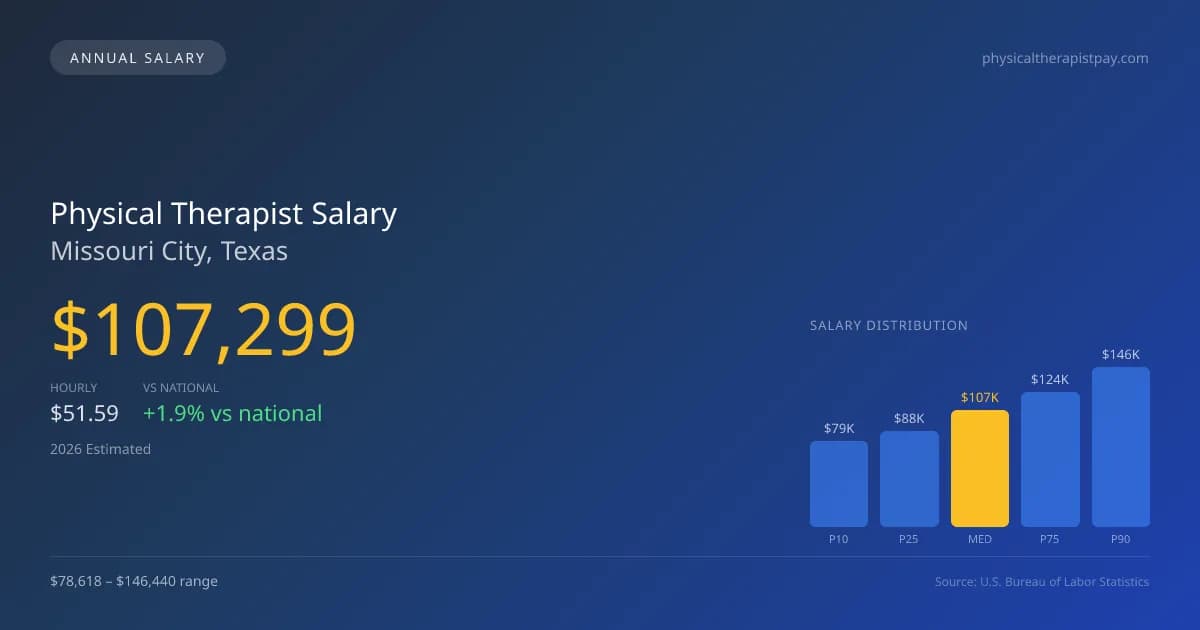
| Percentile | Annual | Hourly |
|---|---|---|
| Entry Level (P10) | $78,618 | $37.80 |
| Lower Range (P25) | $87,715 | $42.17 |
| Median (P50)(typical) | $107,299 | $51.59 |
| Upper Range (P75) | $123,746 | $59.49 |
| Top Earners (P90) | $146,440 | $70.40 |
Median Salary Position
1.91% above the national average
2026 Salary Percentile Distribution in Missouri City
In Missouri City, TX, the physical therapist salary spread from the 10th to 90th percentile is $67,822 (2026 est.). At $107,299, the local median is 1.91% above the national median of $105,288.
Salary Calculator
At 40 hours/week in Missouri City: You'd be in the lower-middle range
How Missouri City Physical Therapist Pay Compares
Missouri City median: $107,299/year (2026)
| Compared To | Median Salary | Missouri City Pays |
|---|---|---|
| Texas Average | $107,192 | +0.10% more |
| National Average | $105,288 | +1.91% more |
Physical Therapists in Missouri City, TX earn a median of $107,299 per year (2026 est.), which is 1.91% higher than the national median of $105,288 and 0.10% above the Texas state average of $107,192.
Cost-of-Living Adjusted Salary
Missouri City has a cost of living 4.00% below the national average, meaning your salary goes further here.
Adjusted salary = nominal × (100 / CoL index). CoL index: 100 = national average.
Missouri City, TX has a cost-of-living index of 96 (below the national average of 100). A physical therapist earning $107,299 nominally has purchasing power equivalent to $111,770 in an average-cost city — an effective 4.17% boost.
Compare Purchasing Power
Select a city to see how your salary compares after cost of living
Select a city above to compare purchasing power
2019 BLS Actual
$91,149
2025 BLS Actual
$104,723
2026 Current Est.
$107,299
2019–2027 Growth
+20.6%
Salary Trajectory for Physical Therapists in Missouri City (2019–2027)
2019–2025: actual BLS OEWS data for this metro area. 2026+: CAGR 2.46% projection.
| Year | Annual Salary | Status |
|---|---|---|
| 2019 | $91,149 | Actual |
| 2020 | $92,749 | Actual |
| 2021 | $97,447 | Actual |
| 2022 | $99,587 | Actual |
| 2023 | $101,615 | Actual |
| 2024 | $96,131 | Actual |
| 2025 | $104,723 | Actual |
| 2026(current) | $107,299 | Estimated |
| 2027 | $109,939 | Projected |
Based on 7 years of BLS OEWS data for the Missouri City metropolitan area, the median physical therapist salary grew 14.9% from $91,149 (2019) to $104,723 (2025). At a 2.46% compound annual growth rate, salaries are projected to reach $109,939 by 2027 — a total increase of $18,790 (20.61%) from 2019.
Note: Historical values (2019–2025) are actual BLS OEWS figures for the Missouri City metropolitan area, sourced from annual Occupational Employment and Wage Statistics surveys. 2026–2026 figures are current estimates, and 2027 values are projections, calculated using a 2.46% CAGR derived from 7-year BLS historical data. Actual salaries may vary based on employer, experience, certifications, and local market conditions.
Salary by Experience Level
| Experience | Estimated Salary Range |
|---|---|
| 0-2 years (New Graduate) | $78,618 – $87,715 |
| 3-5 years (Mid Career) | $87,715 – $107,299 |
| 5+ years (Experienced) | $107,299 – $123,746 |
| 10+ years (Top Earner) | $123,746 – $146,440 |
PT salary ranges estimated from BLS percentile data. Individual physical therapist compensation varies by employer, certifications, and specialization.
Physical Therapist Job Market in Missouri City
The local job market in Missouri City currently employs 12 physical therapists, illustrating a modest yet steady demand in the field. With a cost-of-living index of 96, the relative affordability can enhance take-home pay for PTs working in the area. Among employers, outpatient orthopedic clinics tend to offer slightly lower wages compared to hospital systems, yet they can provide productivity bonuses that elevate earnings potential. Factors influencing the salary spectrum include the expectations for patient visits and board certifications like the OCS or SCS, which can warrant additional stipends. To maximize their earnings, physical therapists in Missouri City should consider positions in high-demand areas such as sports medicine clinics or skilled nursing facilities, and explore opportunities for specialization to enhance their marketability.
More salary data for Missouri City, TX:
Frequently Asked Questions
How much do physical therapists make in Missouri City, TX in 2026?
Is Missouri City, TX a good place to work as a physical therapist?
Can physical therapists make $100K in Missouri City?
What is the cost-of-living adjusted physical therapist salary in Missouri City?
How much does a physical therapist make per hour in Missouri City?
Related Pages
Compare Salaries
Career Resources
Nearby Cities in Texas
Written by Alex Morgan, DPT
Career Analyst
Alex Morgan has over 10 years of experience in physical therapy. They specialize in orthopedic rehabilitation. Alex works in a private practice setting.
Methodology & Data Source
Salary figures on this page are 2026 projections based on the Bureau of Labor Statistics Occupational Employment and Wage Statistics (OEWS) survey, May 2026 release. The BLS reported a median annual salary of $104,723 for physical therapistsin the Missouri City metropolitan area. A 2.46% compound annual growth rate (CAGR), calculated from 6-year national BLS wage trends, was applied to project current 2026 compensation. Percentile ranges (P10–P90) represent the full salary distribution across experience levels and practice settings in this market.
Data Sources & Methodology
Salary data for Missouri City is estimated from official BLS state-level occupational wage data (2025), adjusted for regional cost-of-living differences using BEA RPP (Regional Price Parities).
2026 figures are projected from 2025 BLS data using a compound annual growth rate (CAGR) of 2.46%, derived from historical BLS wage trends for physical therapists (SOC 29-1123).
Compiled and verified by Alex Morgan, DPT, a licensed physical therapist with 10+ years of clinical experience. · View source data at BLS.gov