Physical Therapist Salary in Texarkana, TX: $108,177 (2026)
Quick Answer:A full-time physical therapist in Texarkana, TX earns a median $108,177/year (≈ $52.01/hour) in nominal terms for 2026 — projected from BLS OEWS 2025 (SOC 29-1123). Once you factor in Texarkana's price level (16% below national, BEA RPP 84.0), that paycheck buys what $128,764 would nationally. Nominal pay sits 1.0% above the Texas state average.
Official BLS data · View source
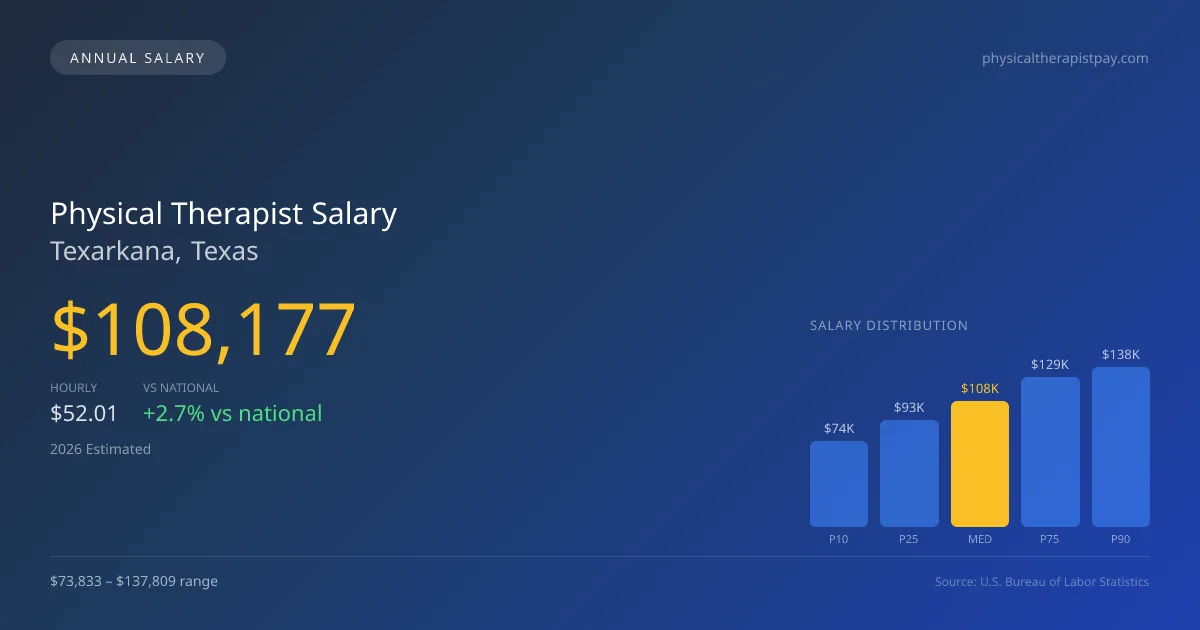
In Texarkana, Texas, a physical therapist can expect to earn a median annual salary of $108,177 in 2026, which is slightly above the national median of $105,288. This robust compensation reflects the area's growing demand for healthcare services, as local PT professionals navigate productivity expectations that often dictate their earnings potential. The salary range spans from $73,833 at the 10th percentile to $137,809 at the 90th percentile, showcasing the income diversity based on experience, specialization, and work setting. The figures are derived from official Bureau of Labor Statistics OEWS surveys, which indicate a healthy job market for physical therapists in Texarkana, driven by factors such as patient volume and reimbursement structures.
Salary Breakdown
| Percentile | Annual | Hourly |
|---|---|---|
| Entry Level (P10) | $73,833 | $35.49 |
| Lower Range (P25) | $92,501 | $44.48 |
| Median (P50)(typical) | $108,177 | $52.01 |
| Upper Range (P75) | $129,376 | $62.20 |
| Top Earners (P90) | $137,809 | $66.25 |
Median Salary Position
2.74% above the national average
2026 Salary Percentile Distribution in Texarkana
In Texarkana, TX, the physical therapist salary spread from the 10th to 90th percentile is $63,976 (2026 est.). At $108,177, the local median is 2.74% above the national median of $105,288.
Salary Calculator
At 40 hours/week in Texarkana: You'd be above the median
How Texarkana Physical Therapist Pay Compares
Texarkana median: $108,177/year (2026)
| Compared To | Median Salary | Texarkana Pays |
|---|---|---|
| Texas Average | $107,106 | +1.00% more |
| National Average | $105,288 | +2.74% more |
Physical Therapists in Texarkana, TX earn a median of $108,177 per year (2026 est.), which is 2.74% higher than the national median of $105,288 and 1.00% above the Texas state average of $107,106.
Cost-of-Living Adjusted Salary
Texarkana has a cost of living 15.99% below the national average, meaning your salary goes further here.
Adjusted salary = nominal × (100 / CoL index). CoL index: 100 = national average.
Texarkana, TX has a cost-of-living index of 84.012 (below the national average of 100). A physical therapist earning $108,177 nominally has purchasing power equivalent to $128,764 in an average-cost city — an effective 19.03% boost.
Compare Purchasing Power
Select a city to see how your salary compares after cost of living
Select a city above to compare purchasing power
2019 BLS Actual
$91,894
2025 BLS Actual
$105,580
2026 Current Est.
$108,177
2019–2027 Growth
+20.6%
Salary Trajectory for Physical Therapists in Texarkana (2019–2027)
2019–2025: actual BLS OEWS data for this metro area. 2026+: CAGR 2.46% projection.
| Year | Annual Salary | Status |
|---|---|---|
| 2019 | $91,894 | Actual |
| 2020 | $93,508 | Actual |
| 2021 | $95,450 | Actual |
| 2022 | $97,570 | Actual |
| 2023 | $103,010 | Actual |
| 2024 | $103,780 | Actual |
| 2025 | $105,580 | Actual |
| 2026(current) | $108,177 | Estimated |
| 2027 | $110,838 | Projected |
Based on 7 years of BLS OEWS data for the Texarkana metropolitan area, the median physical therapist salary grew 14.9% from $91,894 (2019) to $105,580 (2025). At a 2.46% compound annual growth rate, salaries are projected to reach $110,838 by 2027 — a total increase of $18,944 (20.62%) from 2019.
Note: Historical values (2019–2025) are actual BLS OEWS figures for the Texarkana metropolitan area, sourced from annual Occupational Employment and Wage Statistics surveys. 2026–2026 figures are current estimates, and 2027 values are projections, calculated using a 2.46% CAGR derived from 7-year BLS historical data. Actual salaries may vary based on employer, experience, certifications, and local market conditions.
Salary by Experience Level
| Experience | Estimated Salary Range |
|---|---|
| 0-2 years (New Graduate) | $73,833 – $92,501 |
| 3-5 years (Mid Career) | $92,501 – $108,177 |
| 5+ years (Experienced) | $108,177 – $129,376 |
| 10+ years (Top Earner) | $129,376 – $137,809 |
PT salary ranges estimated from BLS percentile data. Individual physical therapist compensation varies by employer, certifications, and specialization.
Physical Therapist Job Market in Texarkana
With 140 physical therapists currently employed in the area, the local job market remains competitive but favorable, especially given Texarkana's cost-of-living index of 84.012, which means that salaries stretch further compared to national averages. Employers like outpatient orthopedic clinics, hospital systems, and skilled nursing facilities typically offer varying salaries, with outpatient clinics sometimes providing less base pay but incorporating productivity bonuses to incentivize performance. Factors influencing the spread between lower and higher salaries include expectations for visits-per-day, patients managed per session, and the presence of advanced board certifications (such as OCS and SCS), which often can command pay differentials. For those looking to maximize physical therapist pay in Texarkana, pursuing specialization, considering cash-pay models versus insurance-based practices, and being adaptable in negotiations with prospective employers can lead to substantial financial benefits.
More salary data for Texarkana, TX:
Frequently Asked Questions
How much do physical therapists make in Texarkana, TX in 2026?
Is Texarkana, TX a good place to work as a physical therapist?
Can physical therapists make $100K in Texarkana?
What is the cost-of-living adjusted physical therapist salary in Texarkana?
How much does a physical therapist make per hour in Texarkana?
Related Pages
Compare Salaries
Career Resources
Nearby Cities in Texas
Written by Alex Morgan, DPT
Career Analyst
Alex Morgan has over 10 years of experience in physical therapy. They specialize in orthopedic rehabilitation. Alex works in a private practice setting.
Methodology & Data Source
Salary figures on this page are 2026 projections based on the Bureau of Labor Statistics Occupational Employment and Wage Statistics (OEWS) survey, May 2026 release. The BLS reported a median annual salary of $105,580 for physical therapistsin the Texarkana metropolitan area. A 2.46% compound annual growth rate (CAGR), calculated from 6-year national BLS wage trends, was applied to project current 2026 compensation. Percentile ranges (P10–P90) represent the full salary distribution across experience levels and practice settings in this market.
Data Sources & Methodology
Source: BLS, OEWS, 5-year dataset (–). Per-city data from annual BLS metropolitan area surveys.
2026 figures are projected from 2025 BLS data using a compound annual growth rate (CAGR) of 2.46%, derived from historical BLS wage trends for physical therapists (SOC 29-1123).
Compiled and verified by Alex Morgan, DPT, a licensed physical therapist with 10+ years of clinical experience. · View source data at BLS.gov