Physical Therapist Salary in Victoria, TX: $105,042 (2026)
Quick Answer:A full-time physical therapist in Victoria, TX earns a median $105,042/year (≈ $50.50/hour) in nominal terms for 2026 — projected from BLS OEWS 2025 (SOC 29-1123). Once you factor in Victoria's price level (10% below national, BEA RPP 89.8), that paycheck buys what $116,922 would nationally. Nominal pay sits 2.0% below the Texas state average.
Official BLS data · View source
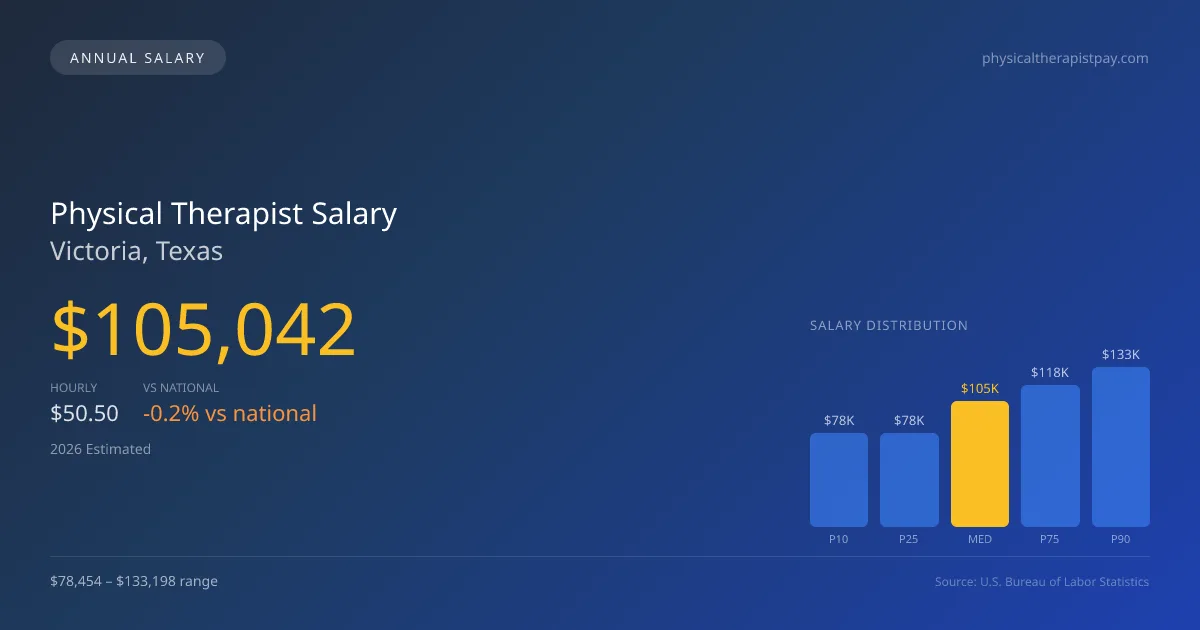
In Victoria, TX, physical therapists are projected to earn a median annual salary of $105,042 in 2026, slightly below the national median of $105,288. The salary spectrum for physical therapists ranges from $78,454 at the 10th percentile to $133,198 at the 90th percentile. This data, derived from official Bureau of Labor Statistics (BLS) OEWS surveys, highlights the local employment landscape, which comprises approximately 140 physical therapists. With the dynamic nature of healthcare and increasing demands for therapy services, understanding the financial aspect of this profession is essential for both current practitioners and aspiring physical therapists seeking to build a rewarding career in Victoria.
Salary Breakdown
| Percentile | Annual | Hourly |
|---|---|---|
| Entry Level (P10) | $78,454 | $37.72 |
| Lower Range (P25) | $78,454 | $37.72 |
| Median (P50)(typical) | $105,042 | $50.50 |
| Upper Range (P75) | $118,044 | $56.75 |
| Top Earners (P90) | $133,198 | $64.04 |
Median Salary Position
0.23% below the national average
2026 Salary Percentile Distribution in Victoria
In Victoria, TX, the physical therapist salary spread from the 10th to 90th percentile is $54,744 (2026 est.). At $105,042, the local median is 0.23% below the national median of $105,288.
Salary Calculator
At 40 hours/week in Victoria: You'd be in the lower-middle range
How Victoria Physical Therapist Pay Compares
Victoria median: $105,042/year (2026)
| Compared To | Median Salary | Victoria Pays |
|---|---|---|
| Texas Average | $107,186 | -2.00% less |
| National Average | $105,288 | -0.23% less |
Physical Therapists in Victoria, TX earn a median of $105,042 per year (2026 est.), which is 0.23% lower than the national median of $105,288 and 2.00% below the Texas state average of $107,186.
Cost-of-Living Adjusted Salary
Victoria has a cost of living 10.16% below the national average, meaning your salary goes further here.
Adjusted salary = nominal × (100 / CoL index). CoL index: 100 = national average.
Victoria, TX has a cost-of-living index of 89.839 (below the national average of 100). A physical therapist earning $105,042 nominally has purchasing power equivalent to $116,922 in an average-cost city — an effective 11.31% boost.
Compare Purchasing Power
Select a city to see how your salary compares after cost of living
Select a city above to compare purchasing power
2019 BLS Actual
$113,610
2025 BLS Actual
$102,520
2026 Current Est.
$105,042
2019–2027 Growth
+-5.3%
Salary Trajectory for Physical Therapists in Victoria (2019–2027)
2019–2025: actual BLS OEWS data for this metro area. 2026+: CAGR 2.46% projection.
| Year | Annual Salary | Status |
|---|---|---|
| 2019 | $113,610 | Actual |
| 2020 | $90,797 | Actual |
| 2021 | $96,060 | Actual |
| 2022 | $96,890 | Actual |
| 2023 | $98,710 | Actual |
| 2024 | $101,220 | Actual |
| 2025 | $102,520 | Actual |
| 2026(current) | $105,042 | Estimated |
| 2027 | $107,626 | Projected |
Based on 7 years of BLS OEWS data for the Victoria metropolitan area, the median physical therapist salary grew -9.8% from $113,610 (2019) to $102,520 (2025). At a 2.46% compound annual growth rate, salaries are projected to reach $107,626 by 2027 — a total increase of $-5,984 (-5.27%) from 2019.
Note: Historical values (2019–2025) are actual BLS OEWS figures for the Victoria metropolitan area, sourced from annual Occupational Employment and Wage Statistics surveys. 2026–2026 figures are current estimates, and 2027 values are projections, calculated using a 2.46% CAGR derived from 7-year BLS historical data. Actual salaries may vary based on employer, experience, certifications, and local market conditions.
Salary by Experience Level
| Experience | Estimated Salary Range |
|---|---|
| 0-2 years (New Graduate) | $78,454 – $78,454 |
| 3-5 years (Mid Career) | $78,454 – $105,042 |
| 5+ years (Experienced) | $105,042 – $118,044 |
| 10+ years (Top Earner) | $118,044 – $133,198 |
PT salary ranges estimated from BLS percentile data. Individual physical therapist compensation varies by employer, certifications, and specialization.
Physical Therapist Job Market in Victoria
The local job market for physical therapists indicates a stable presence, yet the cost of living index at 89.839 suggests that take-home purchasing power can be favorable compared to the national average. To maximize physical therapist pay in Victoria, professionals should consider working in settings that offer higher compensation, such as hospital inpatient rehab or specialized outpatient clinics, like those under larger chains. Variations in salary can arise from productivity expectations, board certifications such as OCS and SCS that command higher pay, and the potential for ownership stakes in practice settings. Additionally, pursuing opportunities in cash-pay models as opposed to traditional insurance practices can enhance earnings, particularly in an evolving healthcare landscape where patients increasingly seek direct access to services without intermediary billing pressures.
More salary data for Victoria, TX:
Frequently Asked Questions
How much do physical therapists make in Victoria, TX in 2026?
Is Victoria, TX a good place to work as a physical therapist?
Can physical therapists make $100K in Victoria?
What is the cost-of-living adjusted physical therapist salary in Victoria?
How much does a physical therapist make per hour in Victoria?
Related Pages
Compare Salaries
Career Resources
Nearby Cities in Texas
Written by Alex Morgan, DPT
Career Analyst
Alex Morgan has over 10 years of experience in physical therapy. They specialize in orthopedic rehabilitation. Alex works in a private practice setting.
Methodology & Data Source
Salary figures on this page are 2026 projections based on the Bureau of Labor Statistics Occupational Employment and Wage Statistics (OEWS) survey, May 2026 release. The BLS reported a median annual salary of $102,520 for physical therapistsin the Victoria metropolitan area. A 2.46% compound annual growth rate (CAGR), calculated from 6-year national BLS wage trends, was applied to project current 2026 compensation. Percentile ranges (P10–P90) represent the full salary distribution across experience levels and practice settings in this market.
Data Sources & Methodology
Source: BLS, OEWS, 6-year dataset (–). Per-city data from annual BLS metropolitan area surveys.
2026 figures are projected from 2025 BLS data using a compound annual growth rate (CAGR) of 2.46%, derived from historical BLS wage trends for physical therapists (SOC 29-1123).
Compiled and verified by Alex Morgan, DPT, a licensed physical therapist with 10+ years of clinical experience. · View source data at BLS.gov