Physical Therapist Salary in Montpelier, VT: $100,366 (2026)
Quick Answer:A full-time physical therapist in Montpelier, VT earns a median $100,366/year (≈ $48.25/hour) in nominal terms for 2026 — projected from BLS OEWS 2025 (SOC 29-1123). Once you factor in Montpelier's price level (4% above national, BEA RPP 103.5), that paycheck buys what $96,972 would nationally. Nominal pay sits 7.9% below the Vermont state average.
Based on BLS state-level estimates · View source
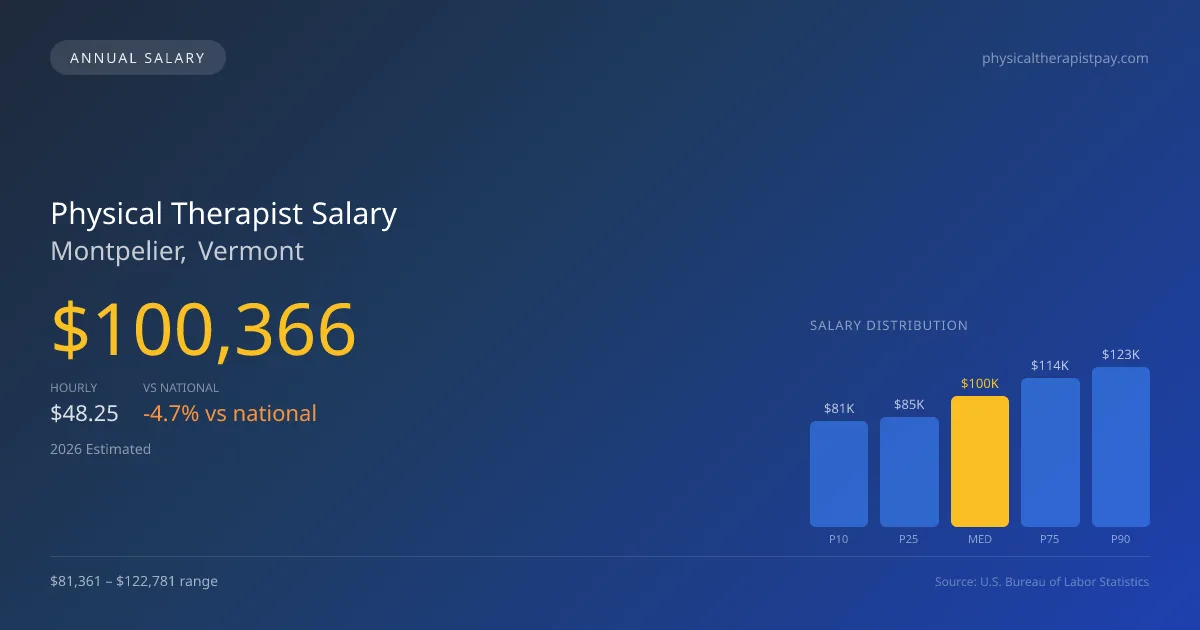
In 2026, the physical therapist salary in Montpelier is projected to reach a median of $100,366, slightly below the national median of $105,288. The local salary range varies from $81,361 at the 10th percentile to $122,781 at the 90th percentile, reflecting a diverse job market that includes cash-pay sports and orthopedic specialists. These professionals often command higher compensation, affecting overall pay trends in the area. Estimates derived from 2025 BLS data, adjusted for regional cost differentials, indicate that Montpelier's salaries are competitive for the size of the city, especially with these rising demands for specialized rehabilitation services.
About the Montpelier Market
Salary estimated from Vermont average ($90,000) adjusted for local cost of living.
Salary Breakdown
| Percentile | Annual | Hourly |
|---|---|---|
| Entry Level (P10) | $81,361 | $39.12 |
| Lower Range (P25) | $84,635 | $40.69 |
| Median (P50)(typical) | $100,366 | $48.25 |
| Upper Range (P75) | $114,363 | $54.98 |
| Top Earners (P90) | $122,781 | $59.03 |
Median Salary Position
4.67% below the national average
2026 Salary Percentile Distribution in Montpelier
In Montpelier, VT, the physical therapist salary spread from the 10th to 90th percentile is $41,420 (2026 est.). At $100,366, the local median is 4.67% below the national median of $105,288.
Salary Calculator
At 40 hours/week in Montpelier: You'd be in the lower-middle range
How Montpelier Physical Therapist Pay Compares
Montpelier median: $100,366/year (2026)
| Compared To | Median Salary | Montpelier Pays |
|---|---|---|
| Vermont Average | $108,975 | -7.90% less |
| National Average | $105,288 | -4.67% less |
Physical Therapists in Montpelier, VT earn a median of $100,366 per year (2026 est.), which is 4.67% lower than the national median of $105,288 and 7.90% below the Vermont state average of $108,975.
Cost-of-Living Adjusted Salary
Montpelier has a cost of living 3.50% above the national average.
Adjusted salary = nominal × (100 / CoL index). CoL index: 100 = national average.
Montpelier, VT has a cost-of-living index of 103.5 (above the national average of 100). While the nominal salary of $100,366 is competitive, the higher cost of living reduces purchasing power to an effective $96,972 — a 3.38% reduction.
Compare Purchasing Power
Select a city to see how your salary compares after cost of living
Select a city above to compare purchasing power
2019 BLS Actual
$85,259
2025 BLS Actual
$97,956
2026 Current Est.
$100,366
2019–2027 Growth
+20.6%
Salary Trajectory for Physical Therapists in Montpelier (2019–2027)
2019–2025: actual BLS OEWS data for this metro area. 2026+: CAGR 2.46% projection.
| Year | Annual Salary | Status |
|---|---|---|
| 2019 | $85,259 | Actual |
| 2020 | $86,755 | Actual |
| 2021 | $91,150 | Actual |
| 2022 | $93,152 | Actual |
| 2023 | $95,049 | Actual |
| 2024 | $85,792 | Actual |
| 2025 | $97,956 | Actual |
| 2026(current) | $100,366 | Estimated |
| 2027 | $102,835 | Projected |
Based on 7 years of BLS OEWS data for the Montpelier metropolitan area, the median physical therapist salary grew 14.9% from $85,259 (2019) to $97,956 (2025). At a 2.46% compound annual growth rate, salaries are projected to reach $102,835 by 2027 — a total increase of $17,576 (20.61%) from 2019.
Note: Historical values (2019–2025) are actual BLS OEWS figures for the Montpelier metropolitan area, sourced from annual Occupational Employment and Wage Statistics surveys. 2026–2026 figures are current estimates, and 2027 values are projections, calculated using a 2.46% CAGR derived from 7-year BLS historical data. Actual salaries may vary based on employer, experience, certifications, and local market conditions.
Salary by Experience Level
| Experience | Estimated Salary Range |
|---|---|
| 0-2 years (New Graduate) | $81,361 – $84,635 |
| 3-5 years (Mid Career) | $84,635 – $100,366 |
| 5+ years (Experienced) | $100,366 – $114,363 |
| 10+ years (Top Earner) | $114,363 – $122,781 |
PT salary ranges estimated from BLS percentile data. Individual physical therapist compensation varies by employer, certifications, and specialization.
Physical Therapist Job Market in Montpelier
The job market for physical therapists in Montpelier features approximately four practitioners, indicating a small yet specialized workforce. The cost of living index at 103.5 signifies that everyday expenses are somewhat higher than the national average, which can impact take-home pay. Among local employers, outpatient orthopedic clinics and travel physical therapy agencies tend to offer the highest compensation packages. Income variation is driven by multiple factors, including productivity expectations per visit, board certification stipends, and business models emphasizing either cash-pay or traditional insurance. To maximize earning potential, physical therapists should consider pursuing board certifications such as OCS or SCS and explore opportunities with private practices, which often provide equity stakes and performance incentives. Understanding these nuances in Montpelier's physical therapist pay landscape will help targeted practitioners make informed career decisions.
More salary data for Montpelier, VT:
Frequently Asked Questions
How much do physical therapists make in Montpelier, VT in 2026?
Is Montpelier, VT a good place to work as a physical therapist?
Can physical therapists make $100K in Montpelier?
What is the cost-of-living adjusted physical therapist salary in Montpelier?
How much does a physical therapist make per hour in Montpelier?
Related Pages
Compare Salaries
Career Resources
Nearby Cities in Vermont
Written by Alex Morgan, DPT
Career Analyst
Alex Morgan has over 10 years of experience in physical therapy. They specialize in orthopedic rehabilitation. Alex works in a private practice setting.
Methodology & Data Source
Salary figures on this page are 2026 projections based on the Bureau of Labor Statistics Occupational Employment and Wage Statistics (OEWS) survey, May 2026 release. The BLS reported a median annual salary of $97,956 for physical therapistsin the Montpelier metropolitan area. A 2.46% compound annual growth rate (CAGR), calculated from 6-year national BLS wage trends, was applied to project current 2026 compensation. Percentile ranges (P10–P90) represent the full salary distribution across experience levels and practice settings in this market.
Data Sources & Methodology
Salary data for Montpelier is estimated from official BLS state-level occupational wage data (2025), adjusted for regional cost-of-living differences using BEA RPP (Regional Price Parities).
2026 figures are projected from 2025 BLS data using a compound annual growth rate (CAGR) of 2.46%, derived from historical BLS wage trends for physical therapists (SOC 29-1123).
Compiled and verified by Alex Morgan, DPT, a licensed physical therapist with 10+ years of clinical experience. · View source data at BLS.gov