Physical Therapist Salary in Danville, VA: $102,582 (2026)
Quick Answer:A full-time physical therapist in Danville, VA earns a median $102,582/year (≈ $49.31/hour) in nominal terms for 2026 — projected from BLS OEWS 2025 (SOC 29-1123). Once you factor in Danville's price level (3% above national, BEA RPP 103.2), that paycheck buys what $99,401 would nationally. Nominal pay sits 2.2% below the Virginia state average.
Based on BLS state-level estimates · View source
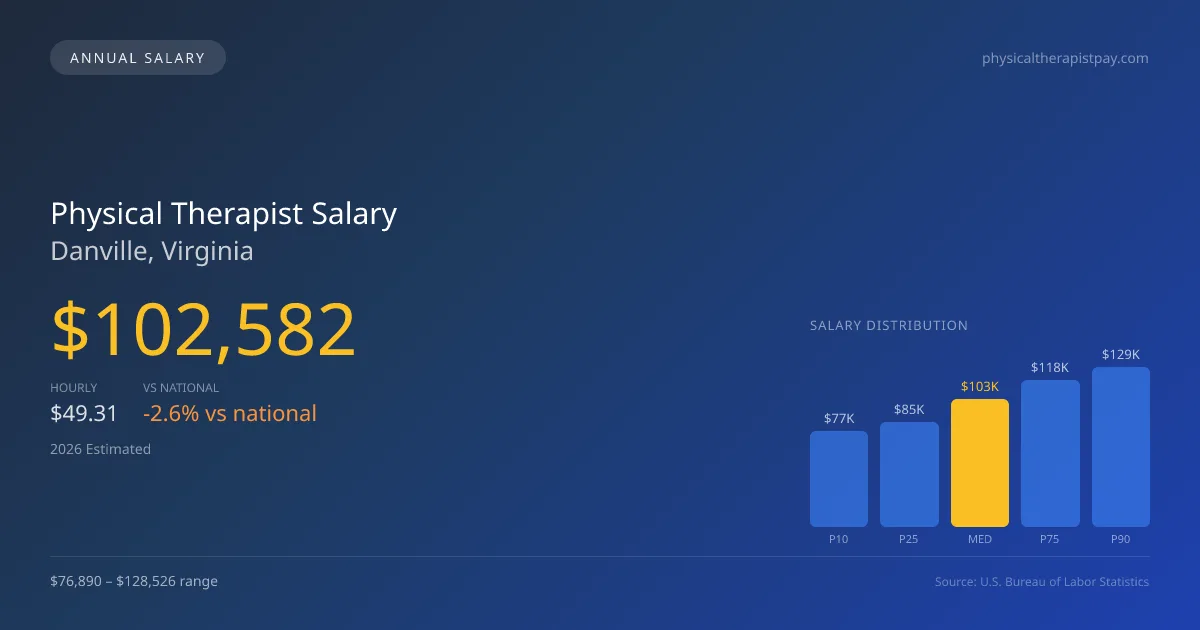
In 2026, the median annual salary for physical therapists in Danville, Virginia, is projected to be $102,582, slightly below the national median of $105,288. Salaries in this area exhibit a broad range, with the lowest 10% earning approximately $76,890 and the top 10% making around $128,526. These figures, based on 2025 BLS data projected to 2026, reflect local economic conditions influenced by pricing adjustments in the region. The job market for physical therapists in Danville is shaped not only by the competitive salary landscape but also by productivity expectations, as increasing visits-per-day is critical for maximizing compensation and addressing healthcare needs in the community.
About the Danville Market
Salary estimated from Virginia average ($95,000) adjusted for local cost of living.
Salary Breakdown
| Percentile | Annual | Hourly |
|---|---|---|
| Entry Level (P10) | $76,890 | $36.97 |
| Lower Range (P25) | $84,706 | $40.73 |
| Median (P50)(typical) | $102,582 | $49.31 |
| Upper Range (P75) | $118,458 | $56.95 |
| Top Earners (P90) | $128,526 | $61.79 |
Median Salary Position
2.57% below the national average
2026 Salary Percentile Distribution in Danville
In Danville, VA, the physical therapist salary spread from the 10th to 90th percentile is $51,636 (2026 est.). At $102,582, the local median is 2.57% below the national median of $105,288.
Salary Calculator
At 40 hours/week in Danville: You'd be above the median
How Danville Physical Therapist Pay Compares
Danville median: $102,582/year (2026)
| Compared To | Median Salary | Danville Pays |
|---|---|---|
| Virginia Average | $104,889 | -2.20% less |
| National Average | $105,288 | -2.57% less |
Physical Therapists in Danville, VA earn a median of $102,582 per year (2026 est.), which is 2.57% lower than the national median of $105,288 and 2.20% below the Virginia state average of $104,889.
Cost-of-Living Adjusted Salary
Danville has a cost of living 3.20% above the national average.
Adjusted salary = nominal × (100 / CoL index). CoL index: 100 = national average.
Danville, VA has a cost-of-living index of 103.2 (above the national average of 100). While the nominal salary of $102,582 is competitive, the higher cost of living reduces purchasing power to an effective $99,401 — a 3.1% reduction.
Compare Purchasing Power
Select a city to see how your salary compares after cost of living
Select a city above to compare purchasing power
2019 BLS Actual
$87,141
2025 BLS Actual
$100,119
2026 Current Est.
$102,582
2019–2027 Growth
+20.6%
Salary Trajectory for Physical Therapists in Danville (2019–2027)
2019–2025: actual BLS OEWS data for this metro area. 2026+: CAGR 2.46% projection.
| Year | Annual Salary | Status |
|---|---|---|
| 2019 | $87,141 | Actual |
| 2020 | $88,671 | Actual |
| 2021 | $93,163 | Actual |
| 2022 | $95,209 | Actual |
| 2023 | $97,147 | Actual |
| 2024 | $95,856 | Actual |
| 2025 | $100,119 | Actual |
| 2026(current) | $102,582 | Estimated |
| 2027 | $105,105 | Projected |
Based on 7 years of BLS OEWS data for the Danville metropolitan area, the median physical therapist salary grew 14.9% from $87,141 (2019) to $100,119 (2025). At a 2.46% compound annual growth rate, salaries are projected to reach $105,105 by 2027 — a total increase of $17,964 (20.61%) from 2019.
Note: Historical values (2019–2025) are actual BLS OEWS figures for the Danville metropolitan area, sourced from annual Occupational Employment and Wage Statistics surveys. 2026–2026 figures are current estimates, and 2027 values are projections, calculated using a 2.46% CAGR derived from 7-year BLS historical data. Actual salaries may vary based on employer, experience, certifications, and local market conditions.
Salary by Experience Level
| Experience | Estimated Salary Range |
|---|---|
| 0-2 years (New Graduate) | $76,890 – $84,706 |
| 3-5 years (Mid Career) | $84,706 – $102,582 |
| 5+ years (Experienced) | $102,582 – $118,458 |
| 10+ years (Top Earner) | $118,458 – $128,526 |
PT salary ranges estimated from BLS percentile data. Individual physical therapist compensation varies by employer, certifications, and specialization.
Physical Therapist Job Market in Danville
In Danville, job opportunities for physical therapists are relatively limited, with only seven professionals currently employed in the area. The cost of living index stands at 103.2, indicating that while salaries may be slightly below the national average, purchasing power can be impacted by local expenses. Among employers, outpatient orthopedic clinics like Athletico and hospital systems typically offer competitive pay compared to skilled nursing and home health agencies. The variance in physical therapist pay in Danville is often driven by factors such as productivity expectations per visit, specialized board certifications (like OCS and SCS), clinic ownership equity, and whether practices operate on a cash-pay or insurance model. To optimize earnings, physical therapists may consider pursuing additional certifications, seeking employment with high-volume clinics, and exploring options within travel PT agencies, which often provide premium pay for flexibility in assignments.
More salary data for Danville, VA:
Frequently Asked Questions
How much do physical therapists make in Danville, VA in 2026?
Is Danville, VA a good place to work as a physical therapist?
Can physical therapists make $100K in Danville?
What is the cost-of-living adjusted physical therapist salary in Danville?
How much does a physical therapist make per hour in Danville?
Related Pages
Compare Salaries
Career Resources
Nearby Cities in Virginia
Written by Alex Morgan, DPT
Career Analyst
Alex Morgan has over 10 years of experience in physical therapy. They specialize in orthopedic rehabilitation. Alex works in a private practice setting.
Methodology & Data Source
Salary figures on this page are 2026 projections based on the Bureau of Labor Statistics Occupational Employment and Wage Statistics (OEWS) survey, May 2026 release. The BLS reported a median annual salary of $100,119 for physical therapistsin the Danville metropolitan area. A 2.46% compound annual growth rate (CAGR), calculated from 6-year national BLS wage trends, was applied to project current 2026 compensation. Percentile ranges (P10–P90) represent the full salary distribution across experience levels and practice settings in this market.
Data Sources & Methodology
Salary data for Danville is estimated from official BLS state-level occupational wage data (2025), adjusted for regional cost-of-living differences using BEA RPP (Regional Price Parities).
2026 figures are projected from 2025 BLS data using a compound annual growth rate (CAGR) of 2.46%, derived from historical BLS wage trends for physical therapists (SOC 29-1123).
Compiled and verified by Alex Morgan, DPT, a licensed physical therapist with 10+ years of clinical experience. · View source data at BLS.gov