Physical Therapist Salary in Radford, VA: $106,076 (2026)
Quick Answer:A full-time physical therapist in Radford, VA earns a median $106,076/year (≈ $50.99/hour) in nominal terms for 2026 — projected from BLS OEWS 2025 (SOC 29-1123). Once you factor in Radford's price level (3% above national, BEA RPP 103.2), that paycheck buys what $102,787 would nationally. Nominal pay sits 1.1% above the Virginia state average.
Based on BLS state-level estimates · View source
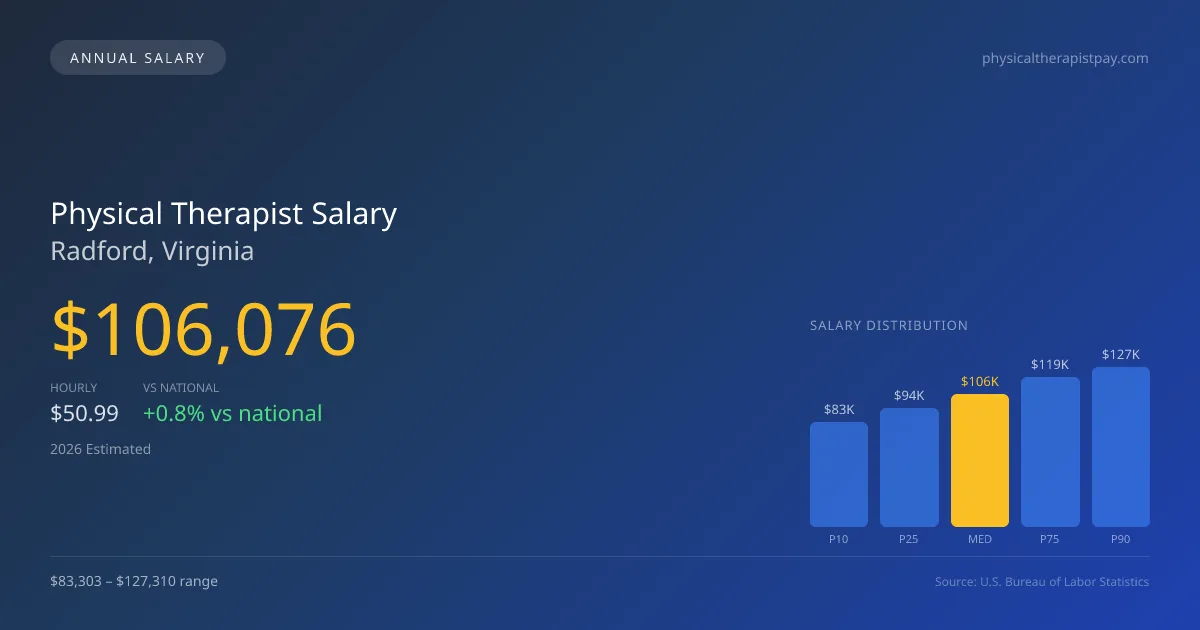
Physical therapists in Radford, Virginia, can expect a 2026 median annual salary of $106,076, which is slightly above the national median of $105,288. The local salary range exhibits considerable variability, spanning from $83,303 for the lowest ten percent to $127,310 for the top ten percent of earners. These figures are derived from estimates based on 2025 BLS data and adjusted for regional cost of living, currently indexed at 103.2 for the area. The growing trend toward cash-pay models in outpatient orthopedic clinics is influencing higher compensation packages, particularly for specialists, making the Radford market an intriguing option for both current physical therapists and those entering the profession.
About the Radford Market
Salary estimated from Virginia average ($95,000) adjusted for local cost of living.
Salary Breakdown
| Percentile | Annual | Hourly |
|---|---|---|
| Entry Level (P10) | $83,303 | $40.05 |
| Lower Range (P25) | $94,397 | $45.38 |
| Median (P50)(typical) | $106,076 | $50.99 |
| Upper Range (P75) | $119,348 | $57.38 |
| Top Earners (P90) | $127,310 | $61.21 |
Median Salary Position
0.75% above the national average
2026 Salary Percentile Distribution in Radford
In Radford, VA, the physical therapist salary spread from the 10th to 90th percentile is $44,007 (2026 est.). At $106,076, the local median is 0.75% above the national median of $105,288.
Salary Calculator
At 40 hours/week in Radford: You'd be above the median
How Radford Physical Therapist Pay Compares
Radford median: $106,076/year (2026)
| Compared To | Median Salary | Radford Pays |
|---|---|---|
| Virginia Average | $104,922 | +1.10% more |
| National Average | $105,288 | +0.75% more |
Physical Therapists in Radford, VA earn a median of $106,076 per year (2026 est.), which is 0.75% higher than the national median of $105,288 and 1.10% above the Virginia state average of $104,922.
Cost-of-Living Adjusted Salary
Radford has a cost of living 3.20% above the national average.
Adjusted salary = nominal × (100 / CoL index). CoL index: 100 = national average.
Radford, VA has a cost-of-living index of 103.2 (above the national average of 100). While the nominal salary of $106,076 is competitive, the higher cost of living reduces purchasing power to an effective $102,787 — a 3.1% reduction.
Compare Purchasing Power
Select a city to see how your salary compares after cost of living
Select a city above to compare purchasing power
2019 BLS Actual
$90,109
2025 BLS Actual
$103,529
2026 Current Est.
$106,076
2019–2027 Growth
+20.6%
Salary Trajectory for Physical Therapists in Radford (2019–2027)
2019–2025: actual BLS OEWS data for this metro area. 2026+: CAGR 2.46% projection.
| Year | Annual Salary | Status |
|---|---|---|
| 2019 | $90,109 | Actual |
| 2020 | $91,691 | Actual |
| 2021 | $96,336 | Actual |
| 2022 | $98,451 | Actual |
| 2023 | $100,456 | Actual |
| 2024 | $93,769 | Actual |
| 2025 | $103,529 | Actual |
| 2026(current) | $106,076 | Estimated |
| 2027 | $108,685 | Projected |
Based on 7 years of BLS OEWS data for the Radford metropolitan area, the median physical therapist salary grew 14.9% from $90,109 (2019) to $103,529 (2025). At a 2.46% compound annual growth rate, salaries are projected to reach $108,685 by 2027 — a total increase of $18,576 (20.62%) from 2019.
Note: Historical values (2019–2025) are actual BLS OEWS figures for the Radford metropolitan area, sourced from annual Occupational Employment and Wage Statistics surveys. 2026–2026 figures are current estimates, and 2027 values are projections, calculated using a 2.46% CAGR derived from 7-year BLS historical data. Actual salaries may vary based on employer, experience, certifications, and local market conditions.
Salary by Experience Level
| Experience | Estimated Salary Range |
|---|---|
| 0-2 years (New Graduate) | $83,303 – $94,397 |
| 3-5 years (Mid Career) | $94,397 – $106,076 |
| 5+ years (Experienced) | $106,076 – $119,348 |
| 10+ years (Top Earner) | $119,348 – $127,310 |
PT salary ranges estimated from BLS percentile data. Individual physical therapist compensation varies by employer, certifications, and specialization.
Physical Therapist Job Market in Radford
In Radford, the job market showcases a robust demand for physical therapists, with six professionals currently employed in the region. This small workforce informs a dynamic landscape where prospective patients seek varied rehabilitation services. Given the cost-of-living index of 103.2, take-home purchasing power is essential for financial stability. Outpatient orthopedic clinics, whether private practices like ATI or regional networks, often offer competitive salaries enriched by productivity bonuses, especially when high-performance metrics are met. Factors such as board certification stipends, ownership stakes, and the difference between cash-pay and insurance-based models can drive salary differences. For those aiming to maximize their pay, obtaining additional certifications like OCS or SCS can be beneficial, along with tracking opportunities in higher-reimbursement settings like specialty or sports medicine clinics in Radford VA.
More salary data for Radford, VA:
Frequently Asked Questions
How much do physical therapists make in Radford, VA in 2026?
Is Radford, VA a good place to work as a physical therapist?
Can physical therapists make $100K in Radford?
What is the cost-of-living adjusted physical therapist salary in Radford?
How much does a physical therapist make per hour in Radford?
Related Pages
Compare Salaries
Career Resources
Nearby Cities in Virginia
Written by Alex Morgan, DPT
Career Analyst
Alex Morgan has over 10 years of experience in physical therapy. They specialize in orthopedic rehabilitation. Alex works in a private practice setting.
Methodology & Data Source
Salary figures on this page are 2026 projections based on the Bureau of Labor Statistics Occupational Employment and Wage Statistics (OEWS) survey, May 2026 release. The BLS reported a median annual salary of $103,529 for physical therapistsin the Radford metropolitan area. A 2.46% compound annual growth rate (CAGR), calculated from 6-year national BLS wage trends, was applied to project current 2026 compensation. Percentile ranges (P10–P90) represent the full salary distribution across experience levels and practice settings in this market.
Data Sources & Methodology
Salary data for Radford is estimated from official BLS state-level occupational wage data (2025), adjusted for regional cost-of-living differences using BEA RPP (Regional Price Parities).
2026 figures are projected from 2025 BLS data using a compound annual growth rate (CAGR) of 2.46%, derived from historical BLS wage trends for physical therapists (SOC 29-1123).
Compiled and verified by Alex Morgan, DPT, a licensed physical therapist with 10+ years of clinical experience. · View source data at BLS.gov