Physical Therapist Salary in Salem, VA: $101,726 (2026)
Quick Answer:A full-time physical therapist in Salem, VA earns a median $101,726/year (≈ $48.90/hour) in nominal terms for 2026 — projected from BLS OEWS 2025 (SOC 29-1123). Once you factor in Salem's price level (3% above national, BEA RPP 103.2), that paycheck buys what $98,572 would nationally. Nominal pay sits 3.0% below the Virginia state average.
Based on BLS state-level estimates · View source
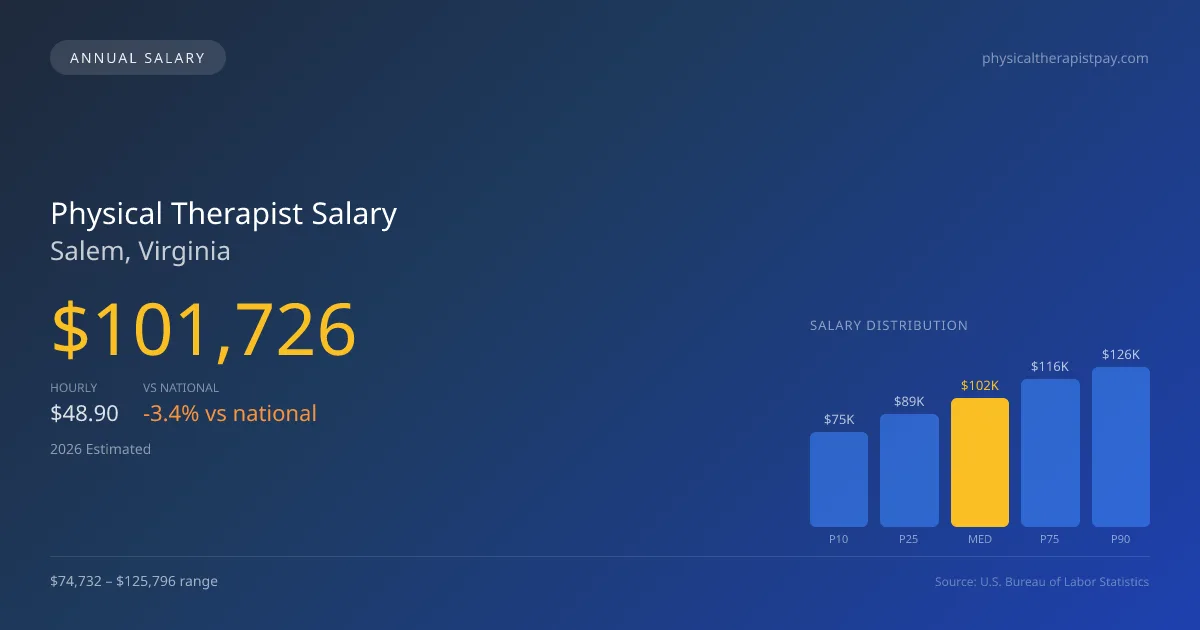
Physical therapists in Salem, Virginia, are seeing projected median earnings of $101,726 in 2026, sitting slightly below the national average of $105,288. The local compensation ranges from $74,732 at the lower 10th percentile to $125,796 for those at the 90th percentile, suggesting variability in pay that reflects differences in experience, specialization, and productivity. These salary estimates are based on 2025 BLS data, accounting for regional price adjustments, demonstrating that while the job market for physical therapists is growing, competition and performance expectations are high. Understanding these dynamics is essential for professionals looking to optimize their income in the area.
About the Salem Market
Salary estimated from Virginia average ($95,000) adjusted for local cost of living.
Salary Breakdown
| Percentile | Annual | Hourly |
|---|---|---|
| Entry Level (P10) | $74,732 | $35.93 |
| Lower Range (P25) | $89,175 | $42.87 |
| Median (P50)(typical) | $101,726 | $48.90 |
| Upper Range (P75) | $116,383 | $55.95 |
| Top Earners (P90) | $125,796 | $60.48 |
Median Salary Position
3.38% below the national average
2026 Salary Percentile Distribution in Salem
In Salem, VA, the physical therapist salary spread from the 10th to 90th percentile is $51,064 (2026 est.). At $101,726, the local median is 3.38% below the national median of $105,288.
Salary Calculator
At 40 hours/week in Salem: You'd be above the median
How Salem Physical Therapist Pay Compares
Salem median: $101,726/year (2026)
| Compared To | Median Salary | Salem Pays |
|---|---|---|
| Virginia Average | $104,873 | -3.00% less |
| National Average | $105,288 | -3.38% less |
Physical Therapists in Salem, VA earn a median of $101,726 per year (2026 est.), which is 3.38% lower than the national median of $105,288 and 3.00% below the Virginia state average of $104,873.
Cost-of-Living Adjusted Salary
Salem has a cost of living 3.20% above the national average.
Adjusted salary = nominal × (100 / CoL index). CoL index: 100 = national average.
Salem, VA has a cost-of-living index of 103.2 (above the national average of 100). While the nominal salary of $101,726 is competitive, the higher cost of living reduces purchasing power to an effective $98,572 — a 3.1% reduction.
Compare Purchasing Power
Select a city to see how your salary compares after cost of living
Select a city above to compare purchasing power
2019 BLS Actual
$86,415
2025 BLS Actual
$99,284
2026 Current Est.
$101,726
2019–2027 Growth
+20.6%
Salary Trajectory for Physical Therapists in Salem (2019–2027)
2019–2025: actual BLS OEWS data for this metro area. 2026+: CAGR 2.46% projection.
| Year | Annual Salary | Status |
|---|---|---|
| 2019 | $86,415 | Actual |
| 2020 | $87,931 | Actual |
| 2021 | $92,386 | Actual |
| 2022 | $94,414 | Actual |
| 2023 | $96,337 | Actual |
| 2024 | $95,057 | Actual |
| 2025 | $99,284 | Actual |
| 2026(current) | $101,726 | Estimated |
| 2027 | $104,229 | Projected |
Based on 7 years of BLS OEWS data for the Salem metropolitan area, the median physical therapist salary grew 14.9% from $86,415 (2019) to $99,284 (2025). At a 2.46% compound annual growth rate, salaries are projected to reach $104,229 by 2027 — a total increase of $17,814 (20.61%) from 2019.
Note: Historical values (2019–2025) are actual BLS OEWS figures for the Salem metropolitan area, sourced from annual Occupational Employment and Wage Statistics surveys. 2026–2026 figures are current estimates, and 2027 values are projections, calculated using a 2.46% CAGR derived from 7-year BLS historical data. Actual salaries may vary based on employer, experience, certifications, and local market conditions.
Salary by Experience Level
| Experience | Estimated Salary Range |
|---|---|
| 0-2 years (New Graduate) | $74,732 – $89,175 |
| 3-5 years (Mid Career) | $89,175 – $101,726 |
| 5+ years (Experienced) | $101,726 – $116,383 |
| 10+ years (Top Earner) | $116,383 – $125,796 |
PT salary ranges estimated from BLS percentile data. Individual physical therapist compensation varies by employer, certifications, and specialization.
Physical Therapist Job Market in Salem
The job market in Salem employs a small number of physical therapists, only 6 at present, which could mean higher visibility and potential for each therapist. However, the cost of living index of 103.2 indicates that while local salaries seem competitive, actual purchasing power may feel more constrained compared to other regions. Outpatient orthopedic clinics generally pay the most, often offering bonuses tied to productivity, particularly for those with specialized certifications such as Orthopedic Clinical Specialist (OCS) or Sports Clinical Specialist (SCS). Variations in pay can be attributed to the demands of productivity targets and whether a therapist operates in a cash-pay model versus traditional insurance practices. To maximize earnings in this environment, therapists should prioritize acquiring board certifications and consider roles in settings that reward high productivity, helping to boost their overall compensation in this competitive market.
More salary data for Salem, VA:
Frequently Asked Questions
How much do physical therapists make in Salem, VA in 2026?
Is Salem, VA a good place to work as a physical therapist?
Can physical therapists make $100K in Salem?
What is the cost-of-living adjusted physical therapist salary in Salem?
How much does a physical therapist make per hour in Salem?
Related Pages
Compare Salaries
Career Resources
Nearby Cities in Virginia
Written by Alex Morgan, DPT
Career Analyst
Alex Morgan has over 10 years of experience in physical therapy. They specialize in orthopedic rehabilitation. Alex works in a private practice setting.
Methodology & Data Source
Salary figures on this page are 2026 projections based on the Bureau of Labor Statistics Occupational Employment and Wage Statistics (OEWS) survey, May 2026 release. The BLS reported a median annual salary of $99,284 for physical therapistsin the Salem metropolitan area. A 2.46% compound annual growth rate (CAGR), calculated from 6-year national BLS wage trends, was applied to project current 2026 compensation. Percentile ranges (P10–P90) represent the full salary distribution across experience levels and practice settings in this market.
Data Sources & Methodology
Salary data for Salem is estimated from official BLS state-level occupational wage data (2025), adjusted for regional cost-of-living differences using BEA RPP (Regional Price Parities).
2026 figures are projected from 2025 BLS data using a compound annual growth rate (CAGR) of 2.46%, derived from historical BLS wage trends for physical therapists (SOC 29-1123).
Compiled and verified by Alex Morgan, DPT, a licensed physical therapist with 10+ years of clinical experience. · View source data at BLS.gov