Physical Therapist Salary in Woodbridge, VA: $100,864 (2026)
Quick Answer:A full-time physical therapist in Woodbridge, VA earns a median $100,864/year (≈ $48.49/hour) in nominal terms for 2026 — projected from BLS OEWS 2025 (SOC 29-1123). Once you factor in Woodbridge's price level (3% above national, BEA RPP 103.2), that paycheck buys what $97,736 would nationally. Nominal pay sits 3.9% below the Virginia state average.
Based on BLS state-level estimates · View source
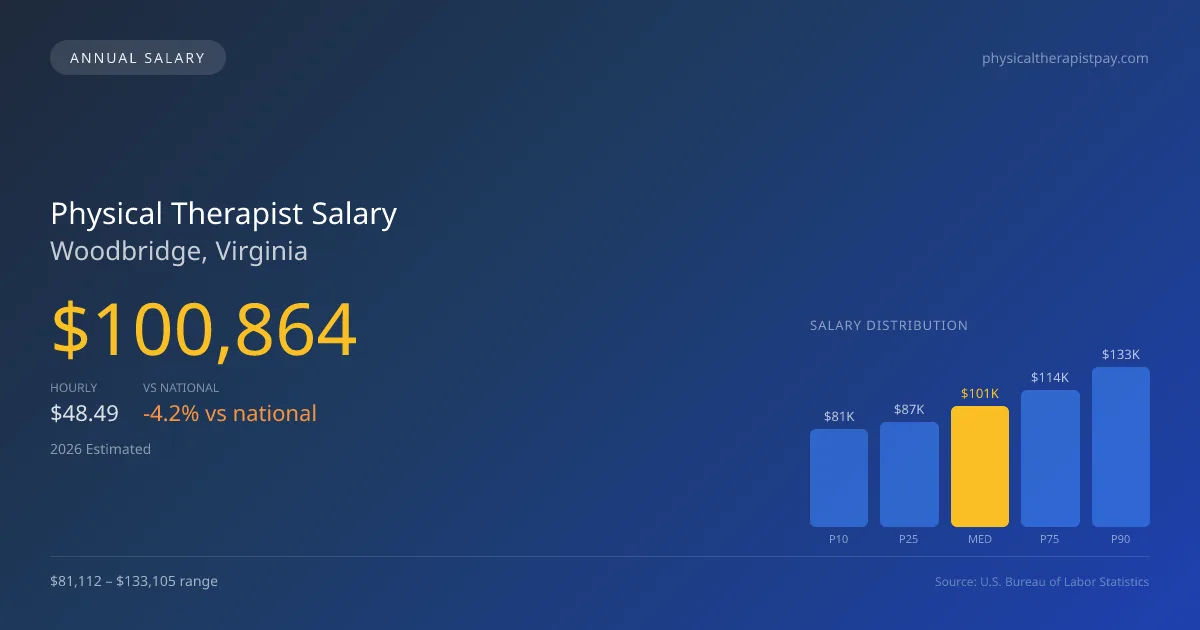
In 2026, physical therapists in Woodbridge, Virginia, can expect to earn a median annual salary of $100,864, a figure slightly below the national median of $105,288. The salary range for this profession in the area spans from $81,112 at the 10th percentile to up to $133,105 at the 90th percentile, reflecting variances in setting and expertise. Local estimates, derived from BLS state-level data and adjusted for regional cost factors, suggest that outpatient orthopedic clinics often offer competitive pay; however, those employed in hospital settings typically see higher compensation levels. The choice between working in outpatient chains versus hospitals can significantly influence earning potential, a consideration for current students and practitioners assessing their career paths in Woodbridge.
About the Woodbridge Market
Salary estimated from Virginia average ($95,000) adjusted for local cost of living.
Salary Breakdown
| Percentile | Annual | Hourly |
|---|---|---|
| Entry Level (P10) | $81,112 | $39.00 |
| Lower Range (P25) | $87,357 | $42.00 |
| Median (P50)(typical) | $100,864 | $48.49 |
| Upper Range (P75) | $114,308 | $54.96 |
| Top Earners (P90) | $133,105 | $64.00 |
Median Salary Position
4.2% below the national average
2026 Salary Percentile Distribution in Woodbridge
In Woodbridge, VA, the physical therapist salary spread from the 10th to 90th percentile is $51,993 (2026 est.). At $100,864, the local median is 4.2% below the national median of $105,288.
Salary Calculator
At 40 hours/week in Woodbridge: You'd be in the lower-middle range
How Woodbridge Physical Therapist Pay Compares
Woodbridge median: $100,864/year (2026)
| Compared To | Median Salary | Woodbridge Pays |
|---|---|---|
| Virginia Average | $104,957 | -3.90% less |
| National Average | $105,288 | -4.20% less |
Physical Therapists in Woodbridge, VA earn a median of $100,864 per year (2026 est.), which is 4.20% lower than the national median of $105,288 and 3.90% below the Virginia state average of $104,957.
Cost-of-Living Adjusted Salary
Woodbridge has a cost of living 3.20% above the national average.
Adjusted salary = nominal × (100 / CoL index). CoL index: 100 = national average.
Woodbridge, VA has a cost-of-living index of 103.2 (above the national average of 100). While the nominal salary of $100,864 is competitive, the higher cost of living reduces purchasing power to an effective $97,736 — a 3.1% reduction.
Compare Purchasing Power
Select a city to see how your salary compares after cost of living
Select a city above to compare purchasing power
2019 BLS Actual
$85,682
2025 BLS Actual
$98,442
2026 Current Est.
$100,864
2019–2027 Growth
+20.6%
Salary Trajectory for Physical Therapists in Woodbridge (2019–2027)
2019–2025: actual BLS OEWS data for this metro area. 2026+: CAGR 2.46% projection.
| Year | Annual Salary | Status |
|---|---|---|
| 2019 | $85,682 | Actual |
| 2020 | $87,186 | Actual |
| 2021 | $91,602 | Actual |
| 2022 | $93,614 | Actual |
| 2023 | $95,520 | Actual |
| 2024 | $94,251 | Actual |
| 2025 | $98,442 | Actual |
| 2026(current) | $100,864 | Estimated |
| 2027 | $103,345 | Projected |
Based on 7 years of BLS OEWS data for the Woodbridge metropolitan area, the median physical therapist salary grew 14.9% from $85,682 (2019) to $98,442 (2025). At a 2.46% compound annual growth rate, salaries are projected to reach $103,345 by 2027 — a total increase of $17,663 (20.61%) from 2019.
Note: Historical values (2019–2025) are actual BLS OEWS figures for the Woodbridge metropolitan area, sourced from annual Occupational Employment and Wage Statistics surveys. 2026–2026 figures are current estimates, and 2027 values are projections, calculated using a 2.46% CAGR derived from 7-year BLS historical data. Actual salaries may vary based on employer, experience, certifications, and local market conditions.
Salary by Experience Level
| Experience | Estimated Salary Range |
|---|---|
| 0-2 years (New Graduate) | $81,112 – $87,357 |
| 3-5 years (Mid Career) | $87,357 – $100,864 |
| 5+ years (Experienced) | $100,864 – $114,308 |
| 10+ years (Top Earner) | $114,308 – $133,105 |
PT salary ranges estimated from BLS percentile data. Individual physical therapist compensation varies by employer, certifications, and specialization.
Physical Therapist Job Market in Woodbridge
With only nine physical therapists practicing in Woodbridge, the local job market remains limited but stable. The cost of living index stands at 103.2, suggesting that while salaries are on par with or slightly below national figures, the higher living costs can impact purchasing power. Outpatient facilities, such as ATI and Athletico, may provide lower base pay compared to hospital inpatient roles, yet they often offer productivity bonuses that can enhance overall earnings, especially for clinicians pushing productivity metrics. Factors driving the earnings spectrum include board certifications like OCS or SCS, clinic ownership equity, as well as the distinction between cash-pay and insurance-based practices. For professionals in Woodbridge, maximizing pay may involve pursuing specializations, enhancing productivity metrics, and exploring opportunities with higher reimbursement potential in home health or sports medicine clinics.
More salary data for Woodbridge, VA:
Frequently Asked Questions
How much do physical therapists make in Woodbridge, VA in 2026?
Is Woodbridge, VA a good place to work as a physical therapist?
Can physical therapists make $100K in Woodbridge?
What is the cost-of-living adjusted physical therapist salary in Woodbridge?
How much does a physical therapist make per hour in Woodbridge?
Related Pages
Compare Salaries
Career Resources
Nearby Cities in Virginia
Written by Alex Morgan, DPT
Career Analyst
Alex Morgan has over 10 years of experience in physical therapy. They specialize in orthopedic rehabilitation. Alex works in a private practice setting.
Methodology & Data Source
Salary figures on this page are 2026 projections based on the Bureau of Labor Statistics Occupational Employment and Wage Statistics (OEWS) survey, May 2026 release. The BLS reported a median annual salary of $98,442 for physical therapistsin the Woodbridge metropolitan area. A 2.46% compound annual growth rate (CAGR), calculated from 6-year national BLS wage trends, was applied to project current 2026 compensation. Percentile ranges (P10–P90) represent the full salary distribution across experience levels and practice settings in this market.
Data Sources & Methodology
Salary data for Woodbridge is estimated from official BLS state-level occupational wage data (2025), adjusted for regional cost-of-living differences using BEA RPP (Regional Price Parities).
2026 figures are projected from 2025 BLS data using a compound annual growth rate (CAGR) of 2.46%, derived from historical BLS wage trends for physical therapists (SOC 29-1123).
Compiled and verified by Alex Morgan, DPT, a licensed physical therapist with 10+ years of clinical experience. · View source data at BLS.gov