Physical Therapist Salary in Marysville, WA: $110,872 (2026)
Quick Answer:A full-time physical therapist in Marysville, WA earns a median $110,872/year (≈ $53.30/hour) in nominal terms for 2026 — projected from BLS OEWS 2025 (SOC 29-1123). Once you factor in Marysville's price level (7% above national, BEA RPP 107.4), that paycheck buys what $103,233 would nationally. Nominal pay sits 0.9% above the Washington state average.
Based on BLS state-level estimates · View source
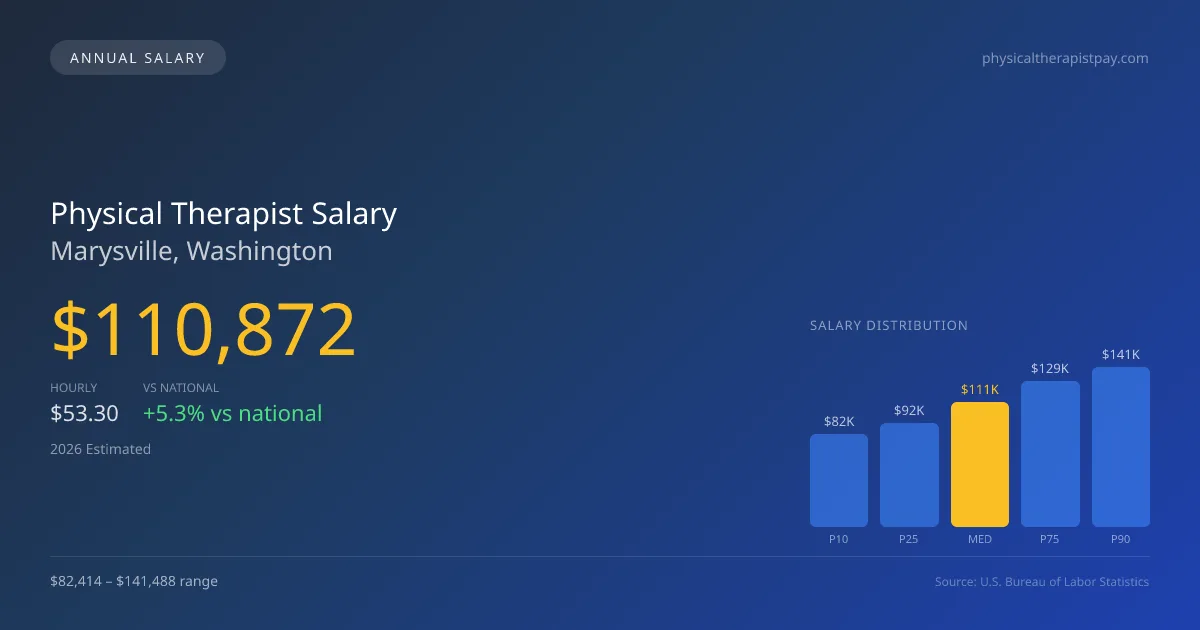
In 2026, physical therapists in Marysville, Washington, can expect a median annual salary of $110,872, which is notably higher than the national median of $105,288. The salary range varies significantly, with entry-level positions starting at $82,414 (P10) and experienced therapists potentially earning as high as $141,488 (P90). These estimates, derived from 2025 BLS data and adjusted for regional cost factors, reflect productivity expectations that significantly shape effective hourly compensation, including pressures related to visits per day. This dynamic is compounded by the growing demand for physical therapy services in Marysville, a trend that is expected to continue supporting opportunities in the job market.
About the Marysville Market
Salary estimated from Washington average ($99,000) adjusted for local cost of living.
Salary Breakdown
| Percentile | Annual | Hourly |
|---|---|---|
| Entry Level (P10) | $82,414 | $39.62 |
| Lower Range (P25) | $91,604 | $44.04 |
| Median (P50)(typical) | $110,872 | $53.30 |
| Upper Range (P75) | $128,878 | $61.96 |
| Top Earners (P90) | $141,488 | $68.02 |
Median Salary Position
5.30% above the national average
2026 Salary Percentile Distribution in Marysville
In Marysville, WA, the physical therapist salary spread from the 10th to 90th percentile is $59,074 (2026 est.). At $110,872, the local median is 5.3% above the national median of $105,288.
Salary Calculator
At 40 hours/week in Marysville: You'd be in the lower-middle range
How Marysville Physical Therapist Pay Compares
Marysville median: $110,872/year (2026)
| Compared To | Median Salary | Marysville Pays |
|---|---|---|
| Washington Average | $109,883 | +0.90% more |
| National Average | $105,288 | +5.30% more |
Physical Therapists in Marysville, WA earn a median of $110,872 per year (2026 est.), which is 5.30% higher than the national median of $105,288 and 0.90% above the Washington state average of $109,883.
Cost-of-Living Adjusted Salary
Marysville has a cost of living 7.40% above the national average.
Adjusted salary = nominal × (100 / CoL index). CoL index: 100 = national average.
Marysville, WA has a cost-of-living index of 107.4 (above the national average of 100). While the nominal salary of $110,872 is competitive, the higher cost of living reduces purchasing power to an effective $103,233 — a 6.89% reduction.
Compare Purchasing Power
Select a city to see how your salary compares after cost of living
Select a city above to compare purchasing power
2019 BLS Actual
$94,184
2025 BLS Actual
$108,210
2026 Current Est.
$110,872
2019–2027 Growth
+20.6%
Salary Trajectory for Physical Therapists in Marysville (2019–2027)
2019–2025: actual BLS OEWS data for this metro area. 2026+: CAGR 2.46% projection.
| Year | Annual Salary | Status |
|---|---|---|
| 2019 | $94,184 | Actual |
| 2020 | $95,837 | Actual |
| 2021 | $100,691 | Actual |
| 2022 | $102,903 | Actual |
| 2023 | $104,998 | Actual |
| 2024 | $107,237 | Actual |
| 2025 | $108,210 | Actual |
| 2026(current) | $110,872 | Estimated |
| 2027 | $113,599 | Projected |
Based on 7 years of BLS OEWS data for the Marysville metropolitan area, the median physical therapist salary grew 14.9% from $94,184 (2019) to $108,210 (2025). At a 2.46% compound annual growth rate, salaries are projected to reach $113,599 by 2027 — a total increase of $19,415 (20.61%) from 2019.
Note: Historical values (2019–2025) are actual BLS OEWS figures for the Marysville metropolitan area, sourced from annual Occupational Employment and Wage Statistics surveys. 2026–2026 figures are current estimates, and 2027 values are projections, calculated using a 2.46% CAGR derived from 7-year BLS historical data. Actual salaries may vary based on employer, experience, certifications, and local market conditions.
Salary by Experience Level
| Experience | Estimated Salary Range |
|---|---|
| 0-2 years (New Graduate) | $82,414 – $91,604 |
| 3-5 years (Mid Career) | $91,604 – $110,872 |
| 5+ years (Experienced) | $110,872 – $128,878 |
| 10+ years (Top Earner) | $128,878 – $141,488 |
PT salary ranges estimated from BLS percentile data. Individual physical therapist compensation varies by employer, certifications, and specialization.
Physical Therapist Job Market in Marysville
Currently, the local job market employs 16 physical therapists, making it a competitive yet lucrative environment for practitioners. The cost-of-living index stands at 107.4, which slightly exceeds the national average, impacting the take-home purchasing power of local therapists. Among the various sectors, outpatient orthopedic clinics, both private practices and larger chains like ATI and Athletico, typically offer the most competitive pay. The spread in salaries is influenced by factors such as clinic productivity expectations, which expect a certain number of units per visit, additional stipends for board certifications like the OCS or SCS, and the choice between cash-pay versus insurance models. Therapists aiming to maximize their earnings in Marysville should consider specializing in high-demand areas, pursuing advanced certifications, and exploring opportunities within thriving outpatient settings or alternative practice models such as travel PT, which can often command higher premiums.
More salary data for Marysville, WA:
Frequently Asked Questions
How much do physical therapists make in Marysville, WA in 2026?
Is Marysville, WA a good place to work as a physical therapist?
Can physical therapists make $100K in Marysville?
What is the cost-of-living adjusted physical therapist salary in Marysville?
How much does a physical therapist make per hour in Marysville?
Related Pages
Compare Salaries
Career Resources
Nearby Cities in Washington
Written by Alex Morgan, DPT
Career Analyst
Alex Morgan has over 10 years of experience in physical therapy. They specialize in orthopedic rehabilitation. Alex works in a private practice setting.
Methodology & Data Source
Salary figures on this page are 2026 projections based on the Bureau of Labor Statistics Occupational Employment and Wage Statistics (OEWS) survey, May 2026 release. The BLS reported a median annual salary of $108,210 for physical therapistsin the Marysville metropolitan area. A 2.46% compound annual growth rate (CAGR), calculated from 6-year national BLS wage trends, was applied to project current 2026 compensation. Percentile ranges (P10–P90) represent the full salary distribution across experience levels and practice settings in this market.
Data Sources & Methodology
Salary data for Marysville is estimated from official BLS state-level occupational wage data (2025), adjusted for regional cost-of-living differences using BEA RPP (Regional Price Parities).
2026 figures are projected from 2025 BLS data using a compound annual growth rate (CAGR) of 2.46%, derived from historical BLS wage trends for physical therapists (SOC 29-1123).
Compiled and verified by Alex Morgan, DPT, a licensed physical therapist with 10+ years of clinical experience. · View source data at BLS.gov