Physical Therapist Salary in Mount Vernon, WA: $116,302 (2026)
Quick Answer:A full-time physical therapist in Mount Vernon, WA earns a median $116,302/year (≈ $55.91/hour) in nominal terms for 2026 — projected from BLS OEWS 2025 (SOC 29-1123). Once you factor in Mount Vernon's price level (2% above national, BEA RPP 102.4), that paycheck buys what $113,528 would nationally. Nominal pay sits 5.8% above the Washington state average.
Official BLS data · View source
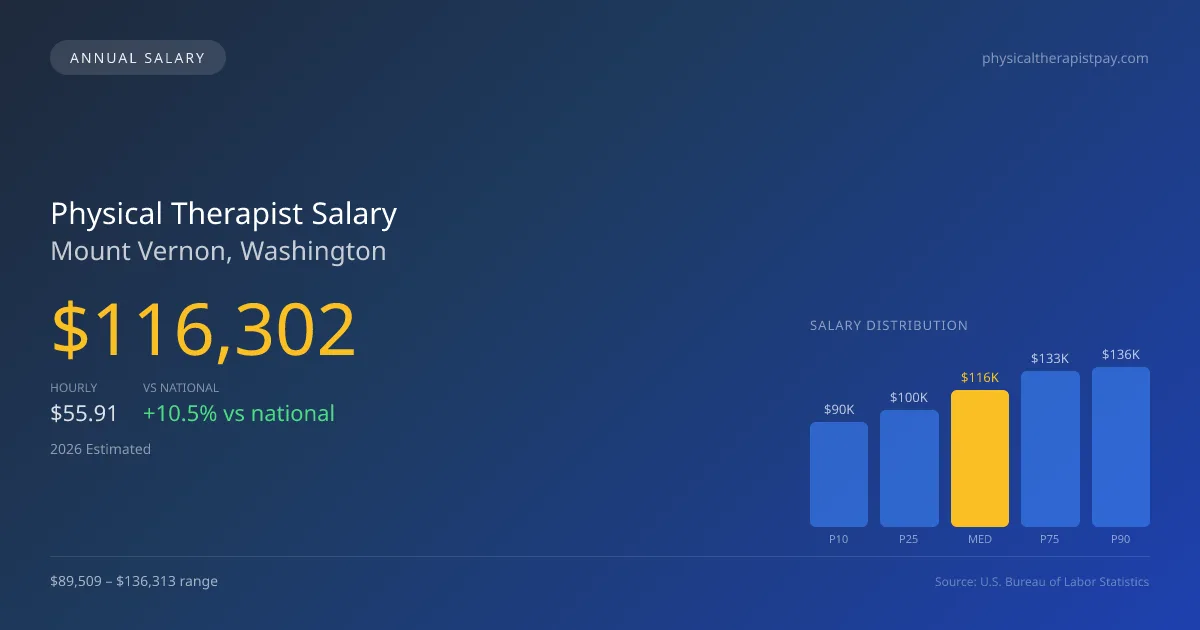
In 2026, the median annual salary for physical therapists in Mount Vernon, Washington, is projected to be $116,302, reflecting the growing trend of cash-pay models in sports and orthopedic specialties, which can elevate compensation at the higher end. Salaries range from approximately $89,509 at the 10th percentile to $136,313 at the 90th percentile, based on projections calculated from 2025 BLS OEWS data. The trend towards direct payment for services rather than relying solely on insurance reimbursement has contributed to this increase, further energizing the job market for physical therapists. With the rising demand for specialized care, the compensation landscape in Mount Vernon is showing promising potential for practitioners in the field.
Salary Breakdown
| Percentile | Annual | Hourly |
|---|---|---|
| Entry Level (P10) | $89,509 | $43.03 |
| Lower Range (P25) | $99,591 | $47.88 |
| Median (P50)(typical) | $116,302 | $55.91 |
| Upper Range (P75) | $132,839 | $63.86 |
| Top Earners (P90) | $136,313 | $65.53 |
Median Salary Position
10.46% above the national average
2026 Salary Percentile Distribution in Mount Vernon
In Mount Vernon, WA, the physical therapist salary spread from the 10th to 90th percentile is $46,804 (2026 est.). At $116,302, the local median is 10.46% above the national median of $105,288.
Salary Calculator
At 40 hours/week in Mount Vernon: You'd be above the median
How Mount Vernon Physical Therapist Pay Compares
Mount Vernon median: $116,302/year (2026)
| Compared To | Median Salary | Mount Vernon Pays |
|---|---|---|
| Washington Average | $109,927 | +5.80% more |
| National Average | $105,288 | +10.46% more |
Physical Therapists in Mount Vernon, WA earn a median of $116,302 per year (2026 est.), which is 10.46% higher than the national median of $105,288 and 5.80% above the Washington state average of $109,927.
Cost-of-Living Adjusted Salary
Mount Vernon has a cost of living 2.44% above the national average.
Adjusted salary = nominal × (100 / CoL index). CoL index: 100 = national average.
Mount Vernon, WA has a cost-of-living index of 102.443 (above the national average of 100). While the nominal salary of $116,302 is competitive, the higher cost of living reduces purchasing power to an effective $113,528 — a 2.39% reduction.
Compare Purchasing Power
Select a city to see how your salary compares after cost of living
Select a city above to compare purchasing power
2019 BLS Actual
$90,490
2025 BLS Actual
$113,510
2026 Current Est.
$116,302
2019–2027 Growth
+31.7%
Salary Trajectory for Physical Therapists in Mount Vernon (2019–2027)
2019–2025: actual BLS OEWS data for this metro area. 2026+: CAGR 2.46% projection.
| Year | Annual Salary | Status |
|---|---|---|
| 2019 | $90,490 | Actual |
| 2020 | $88,390 | Actual |
| 2021 | $99,040 | Actual |
| 2022 | $103,680 | Actual |
| 2023 | $102,660 | Actual |
| 2024 | $108,870 | Actual |
| 2025 | $113,510 | Actual |
| 2026(current) | $116,302 | Estimated |
| 2027 | $119,163 | Projected |
Based on 7 years of BLS OEWS data for the Mount Vernon metropolitan area, the median physical therapist salary grew 25.4% from $90,490 (2019) to $113,510 (2025). At a 2.46% compound annual growth rate, salaries are projected to reach $119,163 by 2027 — a total increase of $28,673 (31.69%) from 2019.
Note: Historical values (2019–2025) are actual BLS OEWS figures for the Mount Vernon metropolitan area, sourced from annual Occupational Employment and Wage Statistics surveys. 2026–2026 figures are current estimates, and 2027 values are projections, calculated using a 2.46% CAGR derived from 7-year BLS historical data. Actual salaries may vary based on employer, experience, certifications, and local market conditions.
Salary by Experience Level
| Experience | Estimated Salary Range |
|---|---|
| 0-2 years (New Graduate) | $89,509 – $99,591 |
| 3-5 years (Mid Career) | $99,591 – $116,302 |
| 5+ years (Experienced) | $116,302 – $132,839 |
| 10+ years (Top Earner) | $132,839 – $136,313 |
PT salary ranges estimated from BLS percentile data. Individual physical therapist compensation varies by employer, certifications, and specialization.
Physical Therapist Job Market in Mount Vernon
The local job market features around 80 physical therapists in Mount Vernon, indicating a stable demand for services. However, the cost-of-living index at 102.443 suggests that take-home purchasing power may be impacted, particularly for those entering the field. Outpatient orthopedic clinics, especially chains like Athletico or ATI and specialty sports medicine facilities, often offer competitive salaries and productivity bonuses for their staff, allowing for higher earnings. The disparity in pay can also stem from factors such as the type of practice model, board certifications like OCS or SCS, and ownership equity. For new graduates or those looking to boost their earnings, pursuing specialized certifications and considering opportunities in high-demand settings like travel PT roles can significantly enhance physical therapist pay in Mount Vernon, WA.
More salary data for Mount Vernon, WA:
Frequently Asked Questions
How much do physical therapists make in Mount Vernon, WA in 2026?
Is Mount Vernon, WA a good place to work as a physical therapist?
Can physical therapists make $100K in Mount Vernon?
What is the cost-of-living adjusted physical therapist salary in Mount Vernon?
How much does a physical therapist make per hour in Mount Vernon?
Related Pages
Compare Salaries
Career Resources
Nearby Cities in Washington
Written by Alex Morgan, DPT
Career Analyst
Alex Morgan has over 10 years of experience in physical therapy. They specialize in orthopedic rehabilitation. Alex works in a private practice setting.
Methodology & Data Source
Salary figures on this page are 2026 projections based on the Bureau of Labor Statistics Occupational Employment and Wage Statistics (OEWS) survey, May 2026 release. The BLS reported a median annual salary of $113,510 for physical therapistsin the Mount Vernon metropolitan area. A 2.46% compound annual growth rate (CAGR), calculated from 6-year national BLS wage trends, was applied to project current 2026 compensation. Percentile ranges (P10–P90) represent the full salary distribution across experience levels and practice settings in this market.
Data Sources & Methodology
Source: BLS, OEWS, 7-year dataset (–). Per-city data from annual BLS metropolitan area surveys.
2026 figures are projected from 2025 BLS data using a compound annual growth rate (CAGR) of 2.46%, derived from historical BLS wage trends for physical therapists (SOC 29-1123).
Compiled and verified by Alex Morgan, DPT, a licensed physical therapist with 10+ years of clinical experience. · View source data at BLS.gov