Physical Therapist Salary in Eau Claire, WI: $101,036 (2026)
Quick Answer:A full-time physical therapist in Eau Claire, WI earns a median $101,036/year (≈ $48.58/hour) in nominal terms for 2026 — projected from BLS OEWS 2025 (SOC 29-1123). Once you factor in Eau Claire's price level (7% below national, BEA RPP 92.8), that paycheck buys what $108,880 would nationally. Nominal pay sits 1.4% below the Wisconsin state average.
Official BLS data · View source
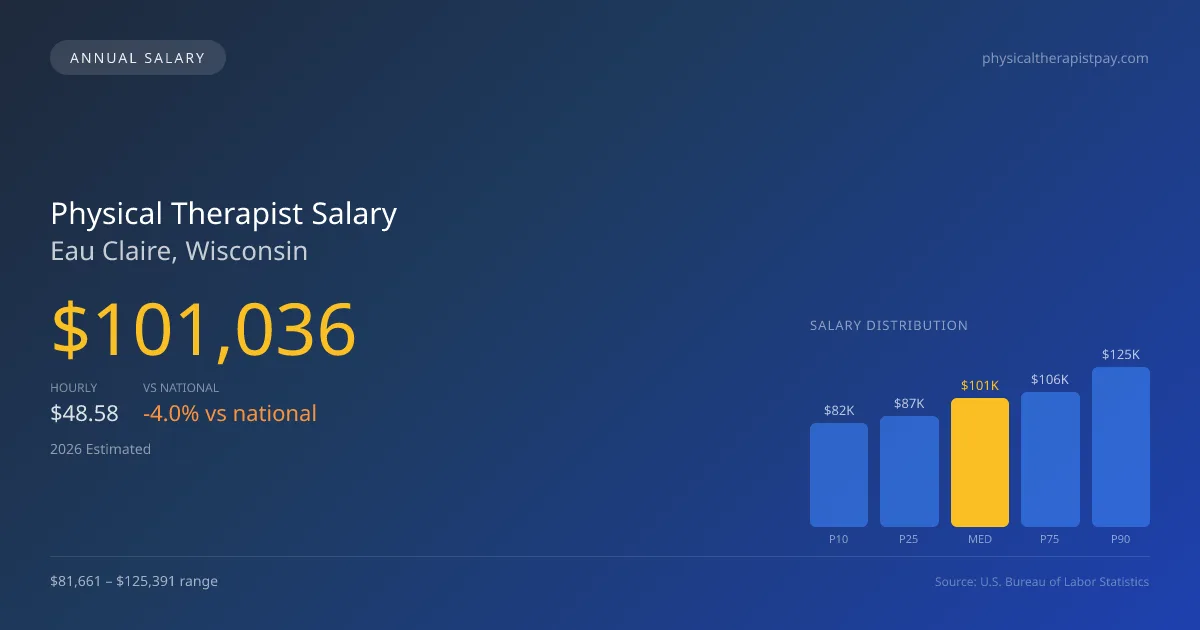
In 2026, physical therapist salaries in Eau Claire, WI, are projected to reach a median of $101,036 annually, which reflects a competitive compensation structure compared to the national median of $105,288. The pay range for physical therapists in the region is notable, spanning from $81,661 at the 10th percentile to $125,391 at the 90th percentile. These figures are derived from the Bureau of Labor Statistics (BLS) OEWS data and illustrate the distinct pay implications based on employment settings such as outpatient clinics versus hospital systems. While outpatient practices may offer lower base salaries, they can sometimes provide performance bonuses based on productivity, shaping the overall compensation landscape within the city.
Salary Breakdown
| Percentile | Annual | Hourly |
|---|---|---|
| Entry Level (P10) | $81,661 | $39.26 |
| Lower Range (P25) | $87,030 | $41.84 |
| Median (P50)(typical) | $101,036 | $48.58 |
| Upper Range (P75) | $105,636 | $50.79 |
| Top Earners (P90) | $125,391 | $60.29 |
Median Salary Position
4.04% below the national average
2026 Salary Percentile Distribution in Eau Claire
In Eau Claire, WI, the physical therapist salary spread from the 10th to 90th percentile is $43,730 (2026 est.). At $101,036, the local median is 4.04% below the national median of $105,288.
Salary Calculator
At 40 hours/week in Eau Claire: You'd be in the lower-middle range
How Eau Claire Physical Therapist Pay Compares
Eau Claire median: $101,036/year (2026)
| Compared To | Median Salary | Eau Claire Pays |
|---|---|---|
| Wisconsin Average | $102,470 | -1.40% less |
| National Average | $105,288 | -4.04% less |
Physical Therapists in Eau Claire, WI earn a median of $101,036 per year (2026 est.), which is 4.04% lower than the national median of $105,288 and 1.40% below the Wisconsin state average of $102,470.
Cost-of-Living Adjusted Salary
Eau Claire has a cost of living 7.20% below the national average, meaning your salary goes further here.
Adjusted salary = nominal × (100 / CoL index). CoL index: 100 = national average.
Eau Claire, WI has a cost-of-living index of 92.796 (below the national average of 100). A physical therapist earning $101,036 nominally has purchasing power equivalent to $108,880 in an average-cost city — an effective 7.76% boost.
Compare Purchasing Power
Select a city to see how your salary compares after cost of living
Select a city above to compare purchasing power
2019 BLS Actual
$93,010
2025 BLS Actual
$98,610
2026 Current Est.
$101,036
2019–2027 Growth
+11.3%
Salary Trajectory for Physical Therapists in Eau Claire (2019–2027)
2019–2025: actual BLS OEWS data for this metro area. 2026+: CAGR 2.46% projection.
| Year | Annual Salary | Status |
|---|---|---|
| 2019 | $93,010 | Actual |
| 2020 | $91,910 | Actual |
| 2021 | $79,870 | Actual |
| 2022 | $91,790 | Actual |
| 2023 | $98,190 | Actual |
| 2024 | $98,530 | Actual |
| 2025 | $98,610 | Actual |
| 2026(current) | $101,036 | Estimated |
| 2027 | $103,521 | Projected |
Based on 7 years of BLS OEWS data for the Eau Claire metropolitan area, the median physical therapist salary grew 6.0% from $93,010 (2019) to $98,610 (2025). At a 2.46% compound annual growth rate, salaries are projected to reach $103,521 by 2027 — a total increase of $10,511 (11.30%) from 2019.
Note: Historical values (2019–2025) are actual BLS OEWS figures for the Eau Claire metropolitan area, sourced from annual Occupational Employment and Wage Statistics surveys. 2026–2026 figures are current estimates, and 2027 values are projections, calculated using a 2.46% CAGR derived from 7-year BLS historical data. Actual salaries may vary based on employer, experience, certifications, and local market conditions.
Salary by Experience Level
| Experience | Estimated Salary Range |
|---|---|
| 0-2 years (New Graduate) | $81,661 – $87,030 |
| 3-5 years (Mid Career) | $87,030 – $101,036 |
| 5+ years (Experienced) | $101,036 – $105,636 |
| 10+ years (Top Earner) | $105,636 – $125,391 |
PT salary ranges estimated from BLS percentile data. Individual physical therapist compensation varies by employer, certifications, and specialization.
Physical Therapist Job Market in Eau Claire
The local job market in Eau Claire employs approximately 170 physical therapists, presenting a solid demand for professionals in the field. With a cost of living index of 92.796, the purchasing power for physical therapists can be quite favorable, making the take-home pay relatively significant in terms of local expenses. Among various employers, outpatient orthopedic clinics like Athletico and hospital inpatient rehab centers generally pay above average, but those with specialized credentials such as OCS or SCS may command higher salaries. Factors influencing the wide salary distribution include productivity expectations, which require many therapists to meet specific metrics, and practice models that differentiate cash-pay from insurance-driven services. To maximize pay, physical therapists in Eau Claire should consider enhancing their qualifications through board certifications, exploring diverse employment environments, and staying attuned to local market trends and employer needs.
More salary data for Eau Claire, WI:
Frequently Asked Questions
How much do physical therapists make in Eau Claire, WI in 2026?
Is Eau Claire, WI a good place to work as a physical therapist?
Can physical therapists make $100K in Eau Claire?
What is the cost-of-living adjusted physical therapist salary in Eau Claire?
How much does a physical therapist make per hour in Eau Claire?
Related Pages
Compare Salaries
Career Resources
Nearby Cities in Wisconsin
Written by Alex Morgan, DPT
Career Analyst
Alex Morgan has over 10 years of experience in physical therapy. They specialize in orthopedic rehabilitation. Alex works in a private practice setting.
Methodology & Data Source
Salary figures on this page are 2026 projections based on the Bureau of Labor Statistics Occupational Employment and Wage Statistics (OEWS) survey, May 2026 release. The BLS reported a median annual salary of $98,610 for physical therapistsin the Eau Claire metropolitan area. A 2.46% compound annual growth rate (CAGR), calculated from 6-year national BLS wage trends, was applied to project current 2026 compensation. Percentile ranges (P10–P90) represent the full salary distribution across experience levels and practice settings in this market.
Data Sources & Methodology
Source: BLS, OEWS, 7-year dataset (–). Per-city data from annual BLS metropolitan area surveys.
2026 figures are projected from 2025 BLS data using a compound annual growth rate (CAGR) of 2.46%, derived from historical BLS wage trends for physical therapists (SOC 29-1123).
Compiled and verified by Alex Morgan, DPT, a licensed physical therapist with 10+ years of clinical experience. · View source data at BLS.gov