Senior Physical Therapist Salary in Des Plaines, IL: $128,973 (2026)
Quick Answer:The top tier of physical therapists working in Des Plaines, IL — those at or above the 90th percentile — pull in $128,973/year or more for 2026, based on BLS OEWS 2025 estimates for SOC 29-1123. Strip back Des Plaines's price premium (BEA RPP 97.1, 3% below national) and that top-decile pay carries the same buying power as $132,825 in average-cost America. The 29% spread above city median typically rewards 7+ years of practice or specialty credentials.
Based on BLS state-level estimates · View source
In Des Plaines, Illinois, senior physical therapists can anticipate commanding salaries that significantly reflect their experience and expertise. For 2026, the median annual salary is projected to be $99,603, with top earners in the 90th percentile achieving as much as $128,973. This range indicates a considerable potential for financial growth in this profession, especially when considering the experience premium that separates median earnings from those of top performers. Ascending to this upper echelon typically requires not just years of practice but also advanced credentials such as board specializations, leadership roles, and a clear track record of patient outcomes. For professionals dedicated to achieving the highest compensation, utilizing specialized skills and seeking opportunities within diverse clinical settings can be essential strategies for maximizing earning potential.
About the Des Plaines Market
Salary estimated from Illinois average ($96,000) adjusted for local cost of living.
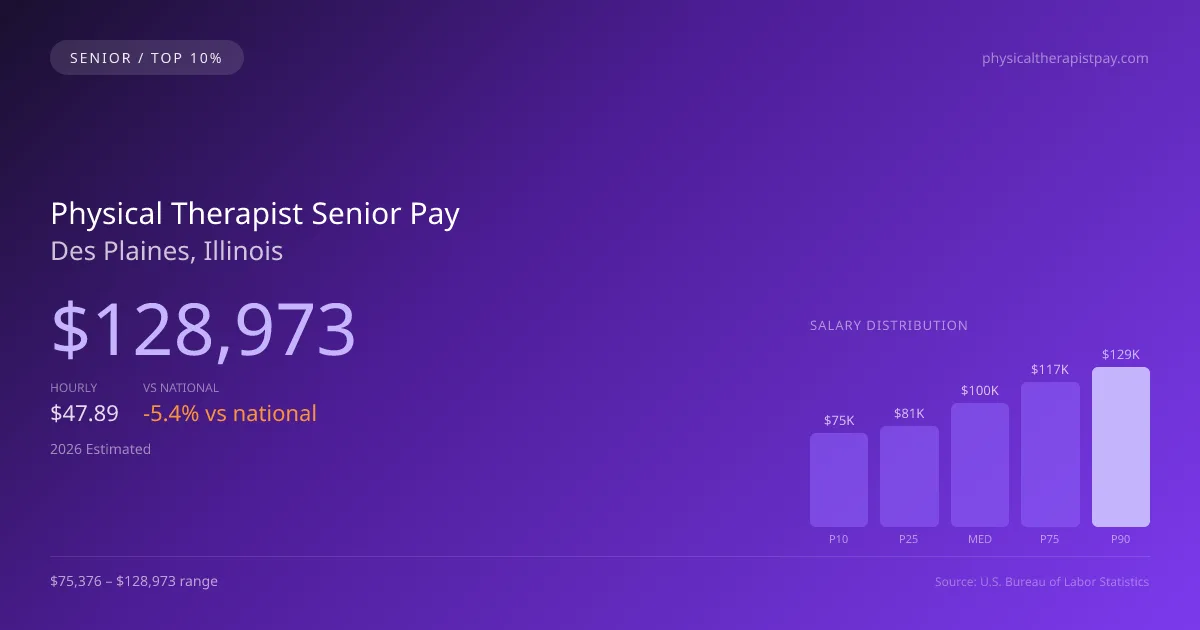
2026 Salary Percentile Distribution in Des Plaines
Experienced physical therapists at the top of the pay scale in Des Plaines earn between $116,668 and $128,973 per year (2026 est.). This $53,597 range from 10th to 90th percentile reflects significant earnings potential growth over a career. The Des Plaines median of $99,603 sits 5.4% below the US median.
Top PT Salary Comparison
| Level | Des Plaines | National |
|---|---|---|
| Median (P50) | $99,603 | $105,288 |
| 75th Percentile | $116,668 | $124,141 |
| 90th Percentile (Top 10%) | $128,973 | $138,464 |
In Des Plaines, experienced physical therapists (P90) earn 29.49% more than the local median — reflecting the significant value of specialization and tenure in this market.
What Drives Top Physical Therapist Pay in Des Plaines
Advanced Certifications in Illinois
IL physical therapists with additional specialty certifications within the physical therapy field earn significantly above the $99,603 median. Expanded-scope credentials are increasingly valued by Des Plaines employers.
Specialty Focus
Physical Therapists focusing on high-acuity or specialty areas within the physical therapy field in Des Plaines command premium compensation, often reaching the $116,668–$128,973 range.
Large Health-System & Multi-Site Experience
Large hospital systems and multi-site employers in the Des Plaines metro area often pay above-market rates for experienced physical therapists who demonstrate efficiency and leadership.
Employer Loyalty & Patient Relationships
Long-tenured physical therapists in Des Plaines with established relationships have strong negotiating leverage. In this developing market, retention bonuses and annual raises are common for top performers.
Continuing Education & Leadership
Physical Therapists in Illinois who pursue advanced degrees, mentor junior staff, or lead clinical education programs position themselves for the highest compensation tiers and management roles.
Physical Therapist Career & Wage Growth Path in Des Plaines
Clinical Physical Therapist
0-5 yearsSenior/Lead Physical Therapist
5-10 yearsPhysical Therapist Department Manager
10+ yearsEducator / Specialty Leadership
AdvancedDes Plaines ranks #46 of 65 Illinois cities for top earner physical therapist salary (90th percentile: $128,973).
Top 10% physical therapist compensation in Des Plaines ($128,973) is 10.48% below the Illinois average P90 ($144,066).
2019 BLS Actual
$116,189
2025 BLS Actual
$125,876
2026 Current Est.
$128,973
2019–2027 Growth
+13.7%
Salary Trajectory for Physical Therapists in Des Plaines (2019–2027)
2019–2025: actual BLS OEWS data for this metro area. 2026+: CAGR 2.46% projection.
| Year | Annual Salary | Status |
|---|---|---|
| 2019 | $116,189 | Actual |
| 2020 | $118,089 | Actual |
| 2021 | $118,396 | Actual |
| 2022 | $119,999 | Actual |
| 2023 | $121,899 | Actual |
| 2024 | $116,375 | Actual |
| 2025 | $125,876 | Actual |
| 2026(current) | $128,973 | Estimated |
| 2027 | $132,145 | Projected |
Top-earning physical therapists (90th percentile) in Des Plaines saw their compensation grow 8.3% from $116,189 in 2019 to $125,876 in 2025, based on 7 years of BLS OEWS data for this metropolitan area. At a 2.46% annual growth rate, senior-level pay is projected to reach $132,145 by 2027, reflecting continued demand for clinical expertise and expanded-function credentials.
Note: Historical values (2019–2025) are actual BLS OEWS figures for the Des Plaines metropolitan area, sourced from annual Occupational Employment and Wage Statistics surveys. 2026–2026 figures are current estimates, and 2027 values are projections, calculated using a 2.46% CAGR derived from 7-year BLS historical data. Actual salaries may vary based on employer, experience, certifications, and local market conditions.
Maximizing Your Physical Therapist Earnings in Des Plaines
The landscape of senior physical therapist pay in IL varies based on several factors, including specialization and employer type. Physical therapists who focus on niches like orthopedic or neurologic care can command higher salaries, elevating their pay substantially above the median. Employment in outpatient orthopedic clinics often presents competitive compensation opportunities, particularly with major chains where performance incentives can heighten earnings; however, these may sometimes fall short of the financial packages offered by larger hospital systems. Beyond specialized training, the pathway to organizational leadership—such as becoming a clinic or regional director—can also be lucrative. Advanced education, such as obtaining a Doctor of Physical Therapy (DPT) or pursuing board certifications, facilitates movement up the compensation ladder. Additionally, non-salary benefits, including clinic ownership equity and variations in clinical practice models (cash-pay vs. insurance) play a vital role in the overall compensation package for experienced physical therapists in Des Plaines, reflecting the evolving demands of the healthcare industry.
More salary data for Des Plaines, IL:
Frequently Asked Questions
How much do experienced physical therapists make in Des Plaines in 2026?
What drives higher physical therapist pay in Des Plaines?
What certifications boost physical therapist salary in Des Plaines?
Can experienced physical therapists make six figures in Des Plaines?
How much does physical therapist salary increase over time in Des Plaines?
Related Pages
Compare Salaries
Career Resources
Nearby Cities in Illinois
Written by Alex Morgan, DPT
Career Analyst
Alex Morgan has over 10 years of experience in physical therapy. They specialize in orthopedic rehabilitation. Alex works in a private practice setting.
Methodology & Data Source
Top-earner salary figures on this page are 2026 projections derived from the Bureau of Labor Statistics Occupational Employment and Wage Statistics (OEWS) survey, May 2026 release. BLS reported a 90th percentile salary of $125,876 for physical therapists in the Des Plaines metro area. A 2.46% compound annual growth rate (CAGR), calculated from 6-year national BLS wage trends, was applied to project current 2026 senior-level compensation. Individual earnings depend on certifications, specialization, practice type, and years of clinical experience.
Data Sources & Methodology
Salary data for Des Plaines is estimated from official BLS state-level occupational wage data (2025), adjusted for regional cost-of-living differences using BEA RPP (Regional Price Parities).
2026 figures are projected from 2025 BLS data using a compound annual growth rate (CAGR) of 2.46%, derived from historical BLS wage trends for physical therapists (SOC 29-1123).
Compiled and verified by Alex Morgan, DPT, a licensed physical therapist with 10+ years of clinical experience. · View source data at BLS.gov