Senior Physical Therapist Salary in Louisville/Jefferson County, KY: $125,134 (2026)
Quick Answer:The top tier of physical therapists working in Louisville/Jefferson County, KY — those at or above the 90th percentile — pull in $125,134/year or more for 2026, based on BLS OEWS 2025 estimates for SOC 29-1123. Strip back Louisville/Jefferson County's price premium (BEA RPP 93.1, 7% below national) and that top-decile pay carries the same buying power as $134,446 in average-cost America. The 19% spread above city median typically rewards 7+ years of practice or specialty credentials.
Official BLS data · View source
Senior physical therapists in Louisville/Jefferson County can anticipate a robust compensation structure, with a top-tier earning potential reaching $125,134 annually for those at the 90th percentile. This figure showcases an attractive difference from the median salary of $104,776, emphasizing the significant financial rewards available for seasoned professionals in Kentucky. Compared to national top earners, where the annual median stands at $105,288, Louisville/Jefferson County's average for top earners is competitively close, presenting a strong market for experienced physical therapists looking to maximize their earning potential. Achieving this level of pay typically requires extensive experience, advanced practice skills, and often specialization in high-demand areas such as orthopedic or sports therapy.
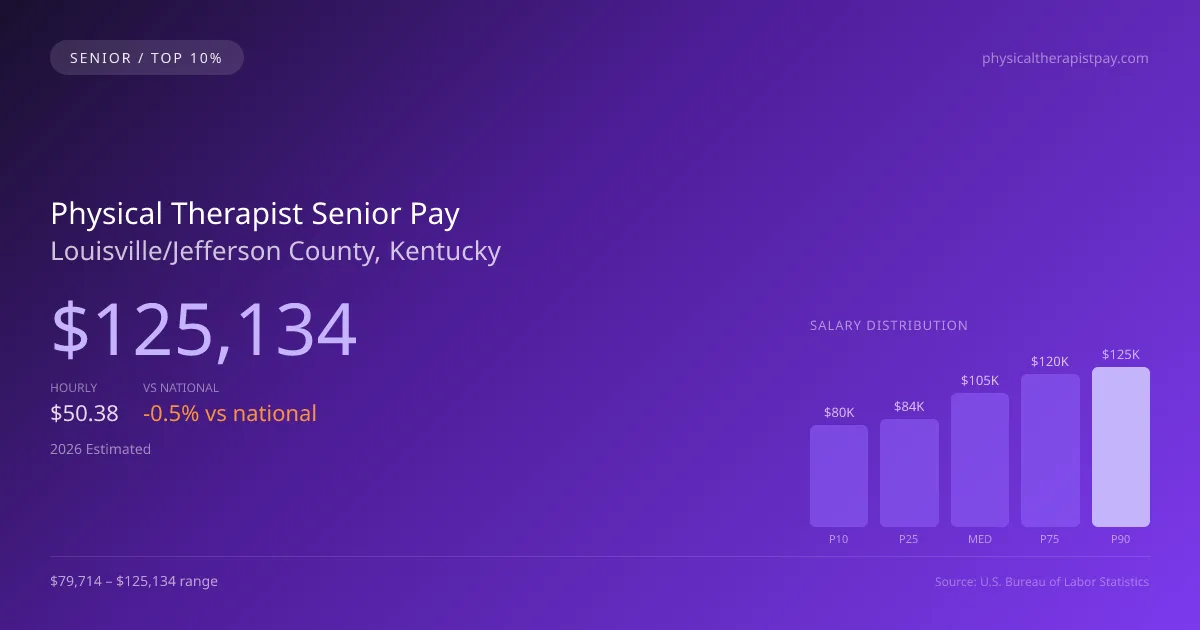
2026 Salary Percentile Distribution in Louisville/Jefferson County
Experienced physical therapists at the top of the pay scale in Louisville/Jefferson County earn between $119,540 and $125,134 per year (2026 est.). This $45,420 range from 10th to 90th percentile reflects significant earnings potential growth over a career. The Louisville/Jefferson County median of $104,776 sits 0.49% below the US median.
Top PT Salary Comparison
| Level | Louisville/Jefferson County | National |
|---|---|---|
| Median (P50) | $104,776 | $105,288 |
| 75th Percentile | $119,540 | $124,141 |
| 90th Percentile (Top 10%) | $125,134 | $138,464 |
In Louisville/Jefferson County, experienced physical therapists (P90) earn 19.43% more than the local median — reflecting the significant value of specialization and tenure in this market.
What Drives Top Physical Therapist Pay in Louisville/Jefferson County
Advanced Certifications in Kentucky
KY physical therapists with additional specialty certifications within the physical therapy field earn significantly above the $104,776 median. Expanded-scope credentials are increasingly valued by Louisville/Jefferson County employers.
Specialty Focus
Physical Therapists focusing on high-acuity or specialty areas within the physical therapy field in Louisville/Jefferson County command premium compensation, often reaching the $119,540–$125,134 range.
Large Health-System & Multi-Site Experience
Large hospital systems and multi-site employers in the Louisville/Jefferson County metro area, which is a large PT employment market, often pay above-market rates for experienced physical therapists who demonstrate efficiency and leadership.
Employer Loyalty & Patient Relationships
Long-tenured physical therapists in Louisville/Jefferson County with established relationships have strong negotiating leverage. In this competitive market, retention bonuses and annual raises are common for top performers.
Continuing Education & Leadership
Physical Therapists in Kentucky who pursue advanced degrees, mentor junior staff, or lead clinical education programs position themselves for the highest compensation tiers and management roles.
Physical Therapist Career & Wage Growth Path in Louisville/Jefferson County
Clinical Physical Therapist
0-5 yearsSenior/Lead Physical Therapist
5-10 yearsPhysical Therapist Department Manager
10+ yearsEducator / Specialty Leadership
AdvancedLouisville/Jefferson County ranks #9 of 21 Kentucky cities for top earner physical therapist salary (90th percentile: $125,134).
Top 10% physical therapist compensation in Louisville/Jefferson County ($125,134) is 1.03% below the Kentucky average P90 ($126,442).
2019 BLS Actual
$111,840
2025 BLS Actual
$122,130
2026 Current Est.
$125,134
2019–2027 Growth
+14.6%
Salary Trajectory for Physical Therapists in Louisville/Jefferson County (2019–2027)
2019–2025: actual BLS OEWS data for this metro area. 2026+: CAGR 2.46% projection.
| Year | Annual Salary | Status |
|---|---|---|
| 2019 | $111,840 | Actual |
| 2020 | $112,980 | Actual |
| 2021 | $123,550 | Actual |
| 2022 | $119,410 | Actual |
| 2023 | $117,340 | Actual |
| 2024 | $115,240 | Actual |
| 2025 | $122,130 | Actual |
| 2026(current) | $125,134 | Estimated |
| 2027 | $128,213 | Projected |
Top-earning physical therapists (90th percentile) in Louisville/Jefferson County saw their compensation grow 9.2% from $111,840 in 2019 to $122,130 in 2025, based on 7 years of BLS OEWS data for this metropolitan area. At a 2.46% annual growth rate, senior-level pay is projected to reach $128,213 by 2027, reflecting continued demand for clinical expertise and expanded-function credentials.
Note: Historical values (2019–2025) are actual BLS OEWS figures for the Louisville/Jefferson County metropolitan area, sourced from annual Occupational Employment and Wage Statistics surveys. 2026–2026 figures are current estimates, and 2027 values are projections, calculated using a 2.46% CAGR derived from 7-year BLS historical data. Actual salaries may vary based on employer, experience, certifications, and local market conditions.
Maximizing Your Physical Therapist Earnings in Louisville/Jefferson County
A variety of factors contribute to compensation differences for senior physical therapists in the Louisville/Jefferson County area. Specialties like orthopedic (OCS) and neurologic (NCS) hold particularly high value, often resulting in elevated pay rates compared to more generalists roles. The type of employer plays a crucial role in determining compensation; outpatient clinics like Athletico might offer bonuses tied to productivity, while hospital systems typically provide higher base salaries with comprehensive benefits. The path to increased compensation and leadership roles can include positions such as clinic director or faculty in DPT programs. Furthermore, advanced credentials like a DPT degree from a CAPTE-accredited program and board certifications (OCS, SCS) significantly enhance prospects. As reimbursement models shift, many senior therapists may also explore cash-pay settings that offer more flexible compensation structures, slightly diverging from traditional insurance-based models while also factoring in productivity targets that influence both salary and job performance incentives.
More salary data for Louisville/Jefferson County, KY:
Frequently Asked Questions
How much do experienced physical therapists make in Louisville/Jefferson County in 2026?
What drives higher physical therapist pay in Louisville/Jefferson County?
What certifications boost physical therapist salary in Louisville/Jefferson County?
Can experienced physical therapists make six figures in Louisville/Jefferson County?
How much does physical therapist salary increase over time in Louisville/Jefferson County?
Related Pages
Compare Salaries
Career Resources
Nearby Cities in Kentucky
Written by Alex Morgan, DPT
Career Analyst
Alex Morgan has over 10 years of experience in physical therapy. They specialize in orthopedic rehabilitation. Alex works in a private practice setting.
Methodology & Data Source
Top-earner salary figures on this page are 2026 projections derived from the Bureau of Labor Statistics Occupational Employment and Wage Statistics (OEWS) survey, May 2026 release. BLS reported a 90th percentile salary of $122,130 for physical therapists in the Louisville/Jefferson County metro area. A 2.46% compound annual growth rate (CAGR), calculated from 6-year national BLS wage trends, was applied to project current 2026 senior-level compensation. Individual earnings depend on certifications, specialization, practice type, and years of clinical experience.
Data Sources & Methodology
Source: BLS, OEWS, 7-year dataset (–). Per-city data from annual BLS metropolitan area surveys.
2026 figures are projected from 2025 BLS data using a compound annual growth rate (CAGR) of 2.46%, derived from historical BLS wage trends for physical therapists (SOC 29-1123).
Compiled and verified by Alex Morgan, DPT, a licensed physical therapist with 10+ years of clinical experience. · View source data at BLS.gov