Senior Physical Therapist Salary in Billings, MT: $125,350 (2026)
Quick Answer:The top tier of physical therapists working in Billings, MT — those at or above the 90th percentile — pull in $125,350/year or more for 2026, based on BLS OEWS 2025 estimates for SOC 29-1123. Strip back Billings's price premium (BEA RPP 93.5, 6% below national) and that top-decile pay carries the same buying power as $134,027 in average-cost America. The 26% spread above city median typically rewards 7+ years of practice or specialty credentials.
Official BLS data · View source
For experienced physical therapists in Billings, Montana, the financial landscape presents significant opportunities for those with seven or more years in the field. Senior physical therapists can achieve top-tier earnings, with the 90th percentile salary reaching $125,350 in 2026, offering an appealing contrast to the median annual salary of $99,407. This gap not only highlights the premium associated with advanced experience but also reflects the competitive nature of the healthcare industry in Billings. To reach the upper echelons of compensation, seasoned professionals should focus on gaining specialized credentials, enhancing their skill sets in high-demand areas, and potentially pursuing leadership positions within their organizations.
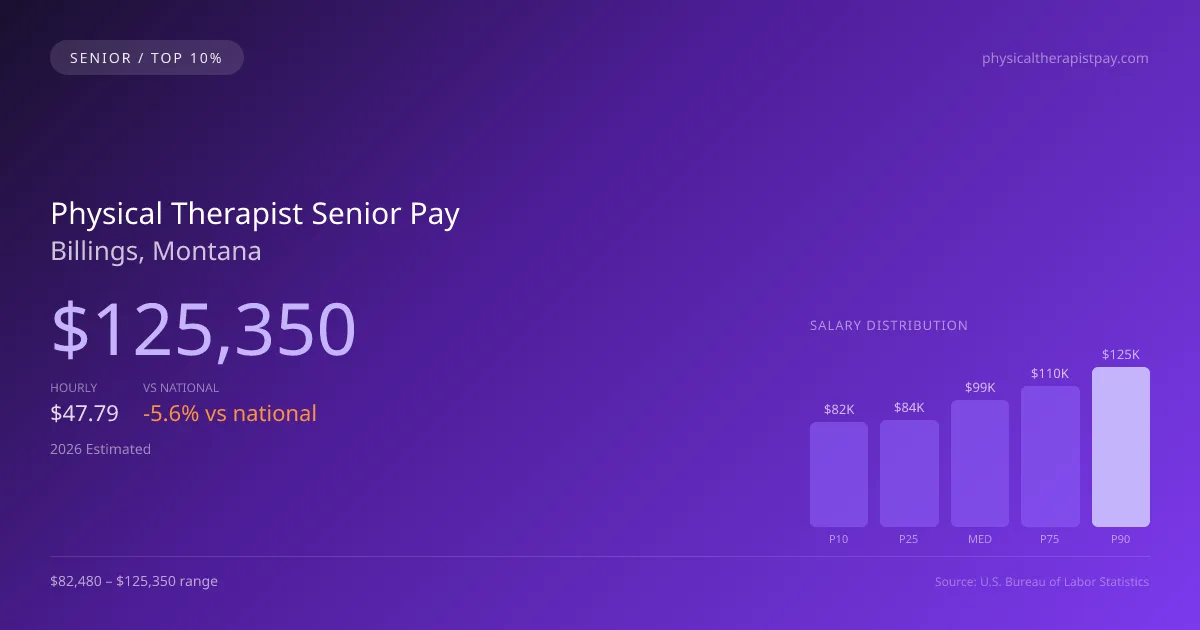
2026 Salary Percentile Distribution in Billings
Experienced physical therapists at the top of the pay scale in Billings earn between $110,349 and $125,350 per year (2026 est.). This $42,870 range from 10th to 90th percentile reflects significant earnings potential growth over a career. The Billings median of $99,407 sits 5.59% below the US median.
Top PT Salary Comparison
| Level | Billings | National |
|---|---|---|
| Median (P50) | $99,407 | $105,288 |
| 75th Percentile | $110,349 | $124,141 |
| 90th Percentile (Top 10%) | $125,350 | $138,464 |
In Billings, experienced physical therapists (P90) earn 26.10% more than the local median — reflecting the significant value of specialization and tenure in this market.
What Drives Top Physical Therapist Pay in Billings
Advanced Certifications in Montana
MT physical therapists with additional specialty certifications within the physical therapy field earn significantly above the $99,407 median. Expanded-scope credentials are increasingly valued by Billings employers.
Specialty Focus
Physical Therapists focusing on high-acuity or specialty areas within the physical therapy field in Billings command premium compensation, often reaching the $110,349–$125,350 range.
Large Health-System & Multi-Site Experience
Large hospital systems and multi-site employers in the Billings metro area often pay above-market rates for experienced physical therapists who demonstrate efficiency and leadership.
Employer Loyalty & Patient Relationships
Long-tenured physical therapists in Billings with established relationships have strong negotiating leverage. In this developing market, retention bonuses and annual raises are common for top performers.
Continuing Education & Leadership
Physical Therapists in Montana who pursue advanced degrees, mentor junior staff, or lead clinical education programs position themselves for the highest compensation tiers and management roles.
Physical Therapist Career & Wage Growth Path in Billings
Clinical Physical Therapist
0-5 yearsSenior/Lead Physical Therapist
5-10 yearsPhysical Therapist Department Manager
10+ yearsEducator / Specialty Leadership
AdvancedBillings ranks #2 of 7 Montana cities for top earner physical therapist salary (90th percentile: $125,350).
Top 10% physical therapist compensation in Billings ($125,350) is 6.82% above the Montana average P90 ($117,345).
2019 BLS Actual
$105,470
2025 BLS Actual
$122,340
2026 Current Est.
$125,350
2019–2027 Growth
+21.8%
Salary Trajectory for Physical Therapists in Billings (2019–2027)
2019–2025: actual BLS OEWS data for this metro area. 2026+: CAGR 2.46% projection.
| Year | Annual Salary | Status |
|---|---|---|
| 2019 | $105,470 | Actual |
| 2020 | $111,580 | Actual |
| 2021 | $104,990 | Actual |
| 2022 | $103,680 | Actual |
| 2023 | $109,160 | Actual |
| 2024 | $120,150 | Actual |
| 2025 | $122,340 | Actual |
| 2026(current) | $125,350 | Estimated |
| 2027 | $128,433 | Projected |
Top-earning physical therapists (90th percentile) in Billings saw their compensation grow 16.0% from $105,470 in 2019 to $122,340 in 2025, based on 7 years of BLS OEWS data for this metropolitan area. At a 2.46% annual growth rate, senior-level pay is projected to reach $128,433 by 2027, reflecting continued demand for clinical expertise and expanded-function credentials.
Note: Historical values (2019–2025) are actual BLS OEWS figures for the Billings metropolitan area, sourced from annual Occupational Employment and Wage Statistics surveys. 2026–2026 figures are current estimates, and 2027 values are projections, calculated using a 2.46% CAGR derived from 7-year BLS historical data. Actual salaries may vary based on employer, experience, certifications, and local market conditions.
Maximizing Your Physical Therapist Earnings in Billings
Senior physical therapists can command higher salaries in Billings through specialization in various fields, such as orthopedic (OCS), sports (SCS), and geriatric (GCS) therapy. Compensation varies significantly depending on the type of employer; outpatient orthopedic clinics often offer productivity bonuses while hospital systems might provide more stable compensation structures. Advancement pathways are robust for those looking to transition into roles such as clinic director or faculty positions in DPT programs. Achieving advanced credentials, such as board certifications and a Doctor of Physical Therapy (DPT) degree, can further enhance earning potential. Additionally, non-salary compensation can shift significantly at senior levels, influenced by factors such as clinic ownership equity and practice models that rely less on insurance reimbursement. Understanding these dynamics is essential for maximizing salary potential in the evolving healthcare market in MT.
More salary data for Billings, MT:
Frequently Asked Questions
How much do experienced physical therapists make in Billings in 2026?
What drives higher physical therapist pay in Billings?
What certifications boost physical therapist salary in Billings?
Can experienced physical therapists make six figures in Billings?
How much does physical therapist salary increase over time in Billings?
Related Pages
Compare Salaries
Career Resources
Nearby Cities in Montana
Written by Alex Morgan, DPT
Career Analyst
Alex Morgan has over 10 years of experience in physical therapy. They specialize in orthopedic rehabilitation. Alex works in a private practice setting.
Methodology & Data Source
Top-earner salary figures on this page are 2026 projections derived from the Bureau of Labor Statistics Occupational Employment and Wage Statistics (OEWS) survey, May 2026 release. BLS reported a 90th percentile salary of $122,340 for physical therapists in the Billings metro area. A 2.46% compound annual growth rate (CAGR), calculated from 6-year national BLS wage trends, was applied to project current 2026 senior-level compensation. Individual earnings depend on certifications, specialization, practice type, and years of clinical experience.
Data Sources & Methodology
Source: BLS, OEWS, 7-year dataset (–). Per-city data from annual BLS metropolitan area surveys.
2026 figures are projected from 2025 BLS data using a compound annual growth rate (CAGR) of 2.46%, derived from historical BLS wage trends for physical therapists (SOC 29-1123).
Compiled and verified by Alex Morgan, DPT, a licensed physical therapist with 10+ years of clinical experience. · View source data at BLS.gov